
Key Points
- USD/CAD reached 1.40144 before reversing lower.
- Purple wave (ii) is now labeled near the 50% Fibonacci retracement.
- The bearish outlook remains intact, with 1.40687 defining invalidation.
USDCAD Rate: USD/CAD stood at 1.39432 at 7:45 a.m. New York time, below its displayed daily opening rate of 1.40101. The four-hour chart records an intraday high of 1.40144.
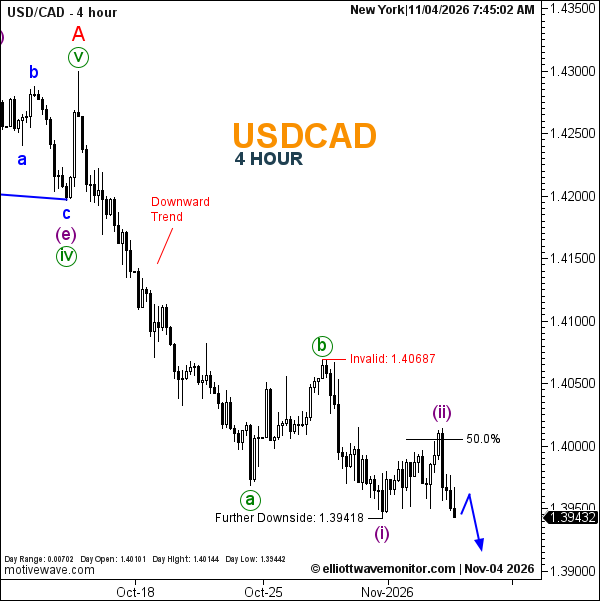
USDCAD Elliott Wave Analysis
The corrective advance anticipated in the November 3 USDCAD technical outlook has reached the projected Fibonacci region before giving way to renewed selling.
The updated Elliott Wave count places purple wave (ii) at the recent recovery peak, suggesting the countertrend advance may have concluded.
Price has subsequently retreated toward the 1.39418 downside reference. The blue projection allows a brief rebound before another bearish extension, although the next decline remains unconfirmed.
Technical Analysis for November 4, 2026
- Trend: Bearish.
- Wave Structure: Purple (ii) provisionally complete.
- Fibonacci: 50% retracement reached.
- Downside Reference: 1.39418.
- Invalidation: 1.40687.
Trader's Question: Has USD/CAD broken its 1.39418 downside reference?
Not on the displayed quote. At 1.39432, the pair remains 1.4 pips above that level. A subsequent break would provide additional evidence of bearish continuation.