
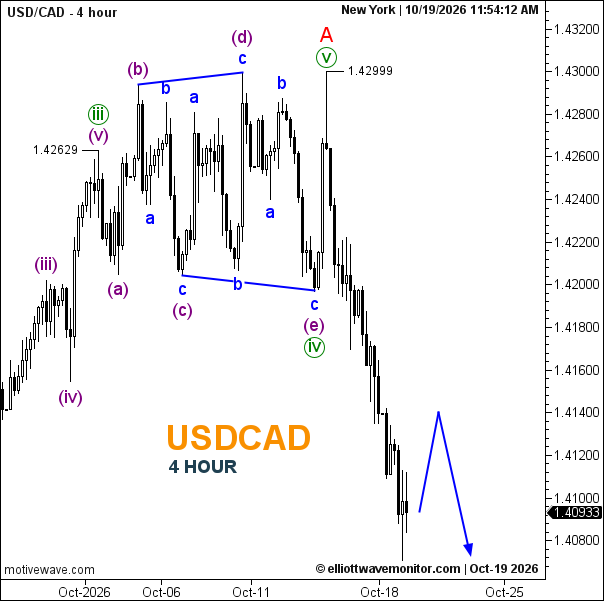
USD/CAD’s count has changed. The four-hour chart shows 1.40933 after a sharp decline from 1.42999, now labelled as the completion of v and A. The preceding iv is an expanding triangle, subdivided (a)–(b)–(c)–(d)–(e).
The projected path allows a corrective rebound toward approximately 1.4140 before renewed weakness toward 1.4070. These moves remain prospective; exceeding 1.42999 would invalidate that peak as the completed A endpoint.
- Trend: Bearish.
- Trading Range: No established sideways range.
- Wave Structure: Triangle iv followed by completed v of A; subsequent decline underway.
- Support: Approximately 1.4070–1.4080.
- Resistance: Around 1.4140, then 1.42999.
Is USD/CAD going up or down?
The chart favours further downside after a possible rebound. Breaking the latest low would support continuation; reclaiming 1.4140 would weaken the immediate projected path.