
USD/CAD maintains a bearish outlook on the 4-hour chart, with the displayed price at 1.39825 following a sustained decline from the wave A and V completion area near 1.42999. The Elliott Wave count identifies the preceding corrective structure through waves (a)-(b)-(c)-(d)-(e), followed by a sharp downward reversal. Successive lower highs and lower lows confirm persistent selling pressure, while the decline toward the annotated 1.39685 level reinforces the bearish structure. The blue projection suggests a temporary rebound toward approximately 1.40300 before renewed weakness below 1.40000. A recovery above 1.40300 would delay the immediate decline, while 1.42999 remains the chart's broader invalidation reference.
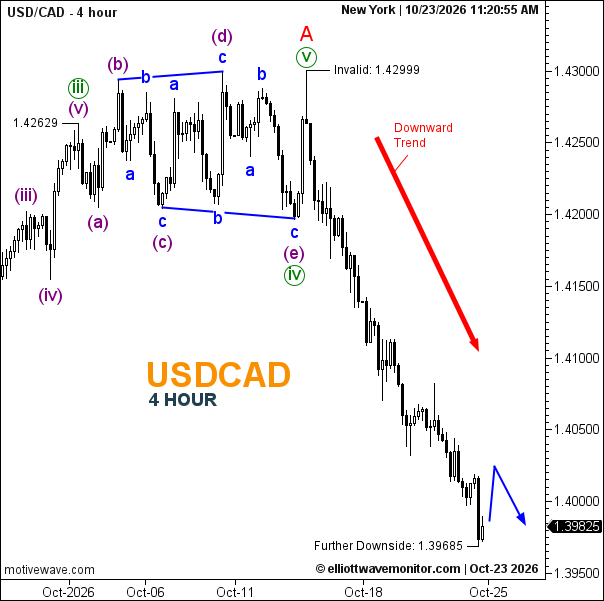
Technical Summary of USD/CAD Price for October 23, 2026
-
Trend: Bearish
-
Daily Support Levels: 1.39685 (annotated); 1.39500 (approximate lower reference).
-
Daily Resistance Levels: 1.40000 (near-term); 1.40300 (projected).
-
Elliott Wave Patterns: Completed corrective (a)-(b)-(c)-(d)-(e) structure, followed by a bearish decline from the wave A/V area; 1.42999 is the annotated invalidation level.
-
Trading Range: Projected downside zone 1.39500–1.39825.
Trader's Question: Can USD/CAD extend its decline after a temporary rebound?
The bearish market structure favors further weakness following a possible recovery toward 1.40300, although a sustained break below 1.39685 is needed to confirm fresh downside.