
USD/JPY’s four-hour chart shows 158.471, testing the marked 61.8% retracement area. The count places x at 158.950, where C completed an ending diagonal with subdivisions (1)–(5). Price subsequently broke the diagonal’s lower boundary. The current rebound may precede renewed weakness toward approximately 157.250. That remains a projection; exceeding 158.950 would challenge the proposed completion of x.
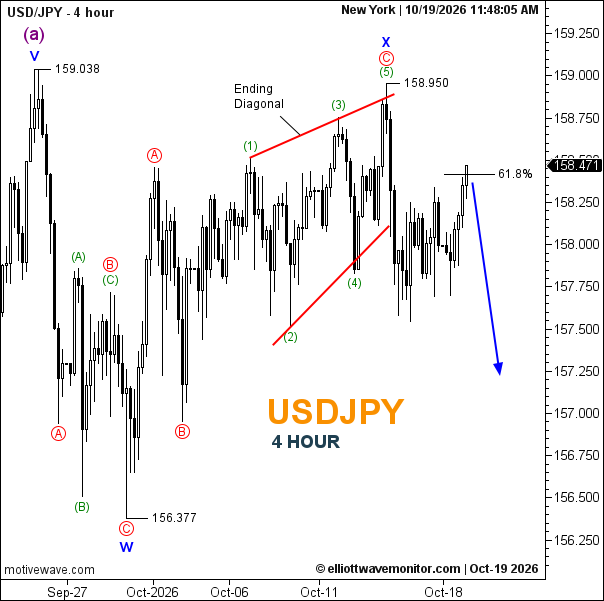
- Trend: Corrective rebound within a bearish scenario.
- Trading Range: Approximately 157.600–158.500.
- Wave Structure: w ended at 156.377; x potentially completed at 158.950.
- Support: Around 157.600, then 156.377.
- Resistance: The marked 61.8% area, then 158.950.
Will USD/JPY go down?
The count favours downside while 158.950 holds. Breaking approximately 157.600 would strengthen continuation toward the projected 157.250 area.