
Key Points
- USD/JPY remains in a corrective phase following its revised bullish Elliott Wave count.
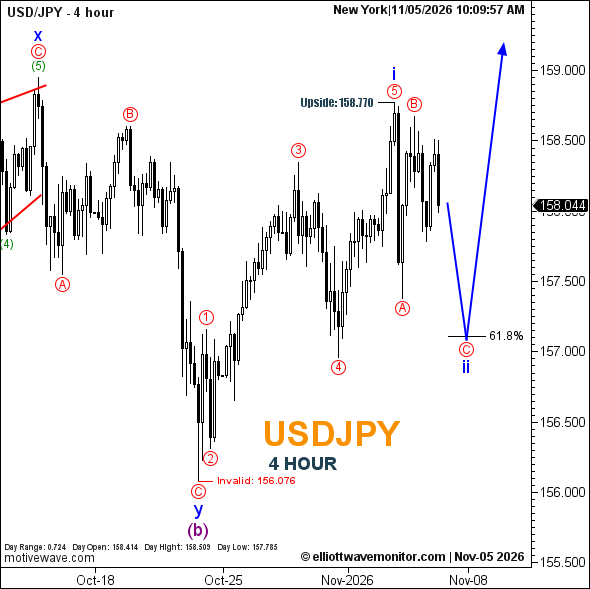
- Red waves A and B are labeled, with wave C projected toward Fibonacci 61.8%.
- The updated scenario establishes 156.076 as its invalidation level.
USDJPY Rate: USD/JPY traded at 158.044 at 10:09 a.m. New York time. The four-hour chart records a daily high of 158.509 and low of 157.785, against an opening rate of 158.414.
USDJPY Elliott Wave Analysis
The corrective structure outlined in the November 4 dollar-yen analysis remains intact, with the latest price action providing further definition of the developing second-wave pullback.
The five-wave leading diagonal that completed blue wave i near 158.770 is unchanged. The updated chart identifies red waves A and B within blue wave ii, while the projected path anticipates further downside through red wave C toward the 61.8% Fibonacci retracement.
A subsequent upward extension remains favored, although the corrective low has not been confirmed.
Technical Analysis for November 5, 2026
- Structure: Leading diagonal completed provisionally within blue i.
- Current Correction: Red C projected within blue ii.
- Fibonacci: 61.8% retracement.
- Upper Reference: 158.770.
- Invalidation: 156.076.
Trader's Question: Does reaching the 61.8% retracement guarantee an upward reversal?
No. The level identifies a potential corrective destination. A sustained upward response would provide stronger evidence that wave ii has concluded.