
USD/JPY’s four-hour chart shows 158.043. Since yesterday, the rebound reached 158.604, now labelled B, before reversing lower. The count retains x at 158.950, following an ending diagonal in C. The subsequent A–B sequence suggests a potential C decline toward approximately 156.900. Breaking A’s low near 157.500 would strengthen continuation; exceeding 158.604 would challenge B’s proposed completion.
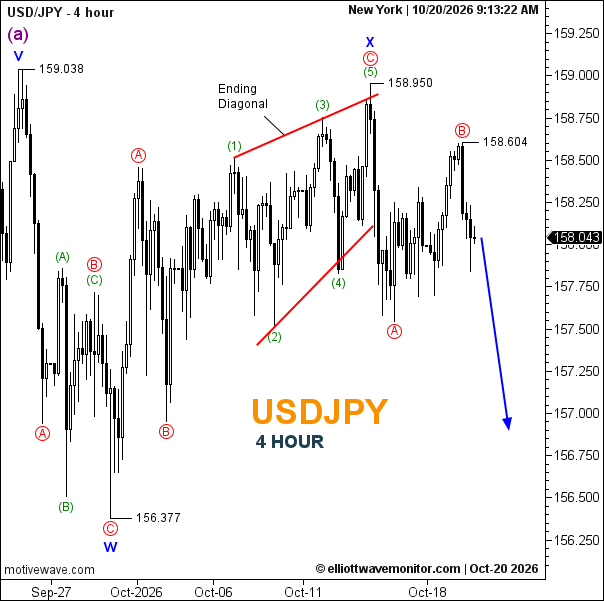
- Trend: Bearish following a corrective rebound.
- Trading Range: Approximately 157.500–158.604.
- Wave Structure: x labelled complete; A–B formed, with C anticipated.
- Support: Around 157.500, then 156.377.
- Resistance: 158.604, followed by 158.950.
Is USD/JPY going up or down?
The chart favours downside while 158.604 caps rebounds. Above it, B may extend; exceeding 158.950 would challenge the proposed completion of x.