
USD/JPY maintains a bearish outlook on the 4-hour chart, trading near 156.924 following a sharp decline from the corrective wave X peak. The Elliott Wave count identifies an ending diagonal within wave (5), followed by a corrective A-B-C structure and a developing five-wave bearish sequence. Price has broken below 157.827, reinforcing selling pressure, while the green wave (3) low near 156.076 remains an important downside reference. The chart projects further weakness toward 156.00 after a limited rebound associated with wave (4). A sustained recovery above 157.827 would weaken immediate bearish momentum, while 158.604 remains the explicitly annotated invalidation level for the bearish outlook.
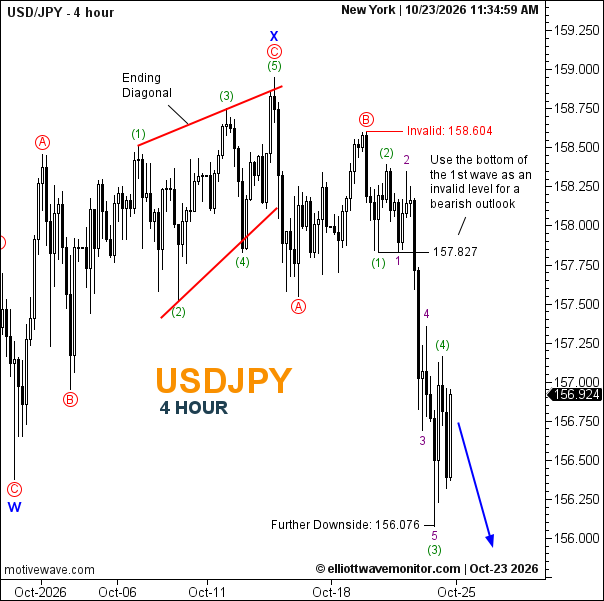
Technical Summary of USD/JPY Price for October 23, 2026
-
Trend: Bearish
-
Daily Support Levels: 156.076 (annotated downside reference); 156.00 (projected).
-
Daily Resistance Levels: 157.827 (annotated); 158.604 (invalidation).
-
Elliott Wave Patterns: Ending diagonal at wave (5), corrective A-B-C structure, and developing bearish waves (1)–(5), with wave (4) labeled and wave 5 projected.
-
Trading Range: Projected downside zone 156.00–156.076.
Trader's Question: Can USD/JPY extend its decline after the current rebound?
The bearish wave structure favors further downside toward 156.00, but a sustained recovery above 157.827 would weaken immediate selling pressure.