
Key Points
- USD/JPY breached the former bearish invalidation at 158.350.
- The rise from 156.076 is now counted as a five-wave leading diagonal.
- Red wave C is developing within blue wave ii before a possible advance.
USDJPY Rate: USD/JPY traded at 158.271 at 8:20 a.m. New York time. The four-hour chart records a daily high of 158.745, low of 157.382 and opening at 158.692.
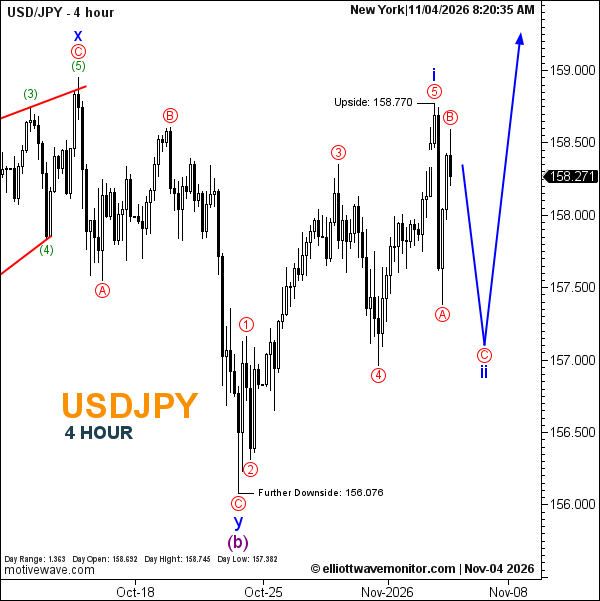
USDJPY Elliott Wave Analysis
Crossing 158.350 invalidated the bearish structure maintained in the November 3 dollar-yen outlook, which had projected a decline toward 156.963. The new chart instead adopts a rising five-wave structure.
The advance from the historical 156.076 low is labeled red waves 1–5 in a leading diagonal, provisionally completing blue wave i near 158.770. Red waves A and B followed, while wave C is now developing inside blue wave ii.
The projected path anticipates completion of that correction before another rise. Neither a numerical upside target nor a new formal invalidation is marked.
Technical Analysis for November 4, 2026
- Previous Scenario: Invalidated above 158.350.
- Current Structure: Leading diagonal within blue i.
- Current Phase: Red C within blue ii.
- Reference Peak: 158.770.
Trader's Question: Does a wave C decline revive the previous bearish forecast?
No. Under the revised count, it represents a second-wave correction, not renewed validation of the invalidated bearish setup. The upward extension remains unconfirmed.