
WTI crude oil (USOilSpot) shows a bearish short-term outlook on the hourly chart, despite recovering to 100.409. The Elliott Wave count identifies wave (i) completed at 101.051, followed by a sharp wave a decline toward the annotated 95.052 target area. The subsequent A-B-C recovery culminates in wave b near 101.00, suggesting renewed selling pressure may follow. The blue projection anticipates a downward continuation toward 95.052, with 98.00 representing an intermediate price reference. The chart explicitly marks 101.051 as the bearish invalidation level. A sustained move above this threshold would challenge the current wave interpretation, while rejection beneath it would strengthen the projected decline.
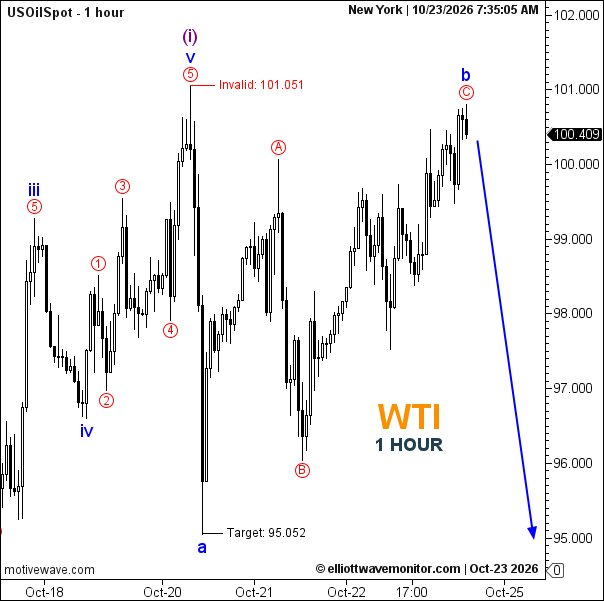
Technical Summary of WTI Crude Oil Price for October 23, 2026
-
Trend: Bearish
-
Key Support: 98.00 (approximate); 95.052 (annotated target)
-
Key Resistance: 101.00 (approximate); 101.051 (invalidation)
-
Projected downside zone 95.00–95.052.
Trader's Question: Has WTI completed wave b and started another bearish sequence?
The labeled A-B-C recovery suggests wave b may be complete, but a sustained reversal below the recent recovery structure is needed to confirm the next decline.