
WTI is at 96.678, slightly above the 96.138 shown on October 16. The chart marks a completed advance from 86.322 to 101.051, followed by a corrective pullback. Its projected path points toward approximately 93 before a possible renewed advance toward 102. The pullback and rebound remain anticipated moves, not confirmed endpoints.
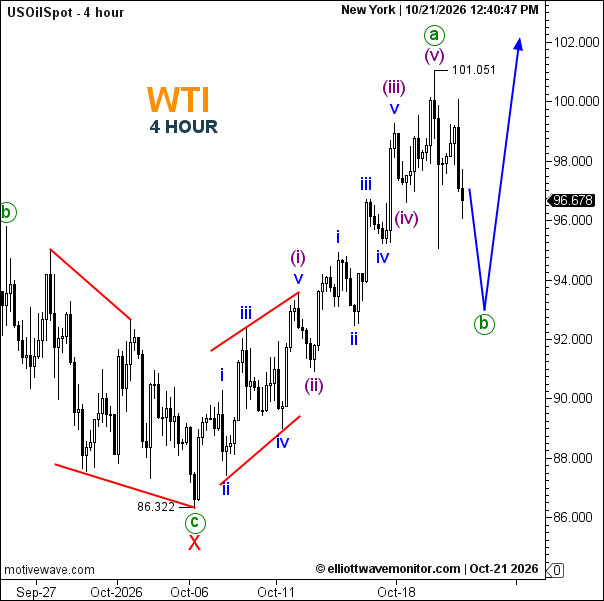
- Trend: Recovery from 86.322, with a near-term correction projected.
- Trading Range: Approximately 93–101.051.
- Wave Structure: Wave (a) is marked at 101.051; wave (b) is projected toward 93.
- Support: Approximately 93, then 86.322.
- Resistance: 101.051, then approximately 102.
Is WTI going up or down? The chart projects a decline toward 93 first, then a possible rise toward 102 if support holds.