
Key Points
- AUD/USD extended below the earlier 50% Fibonacci retracement objective.
- Red wave B is provisionally labeled near the 61.8% retracement.
- The projected path favors renewed appreciation following a possible brief pullback.
Australian Dollar Rate: AUD/USD traded at 0.69798 at 7:47 a.m. New York time. The four-hour chart records a daily low of 0.69618 and high of 0.70037, against an opening rate of 0.69988.
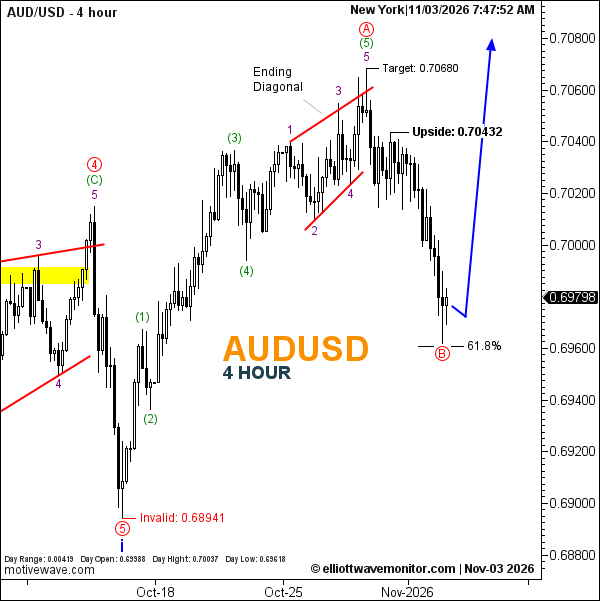
AUDUSD Elliott Wave Analysis
The decline anticipated in the November 2 AUDUSD forecast has extended beyond the initial 0.6980 objective, bringing the correction into the 61.8% Fibonacci region.
The revised count positions red wave B at the latest trough, following the advance that ended provisionally in red wave A through an ending diagonal.
Although the deeper retracement has not invalidated the broader recovery scenario, the wave B completion remains provisional. The blue projection allows another limited dip before a potentially stronger advance.
Technical Analysis for November 3, 2026
- Structure: Red wave B provisionally labeled.
- Fibonacci: 61.8% retracement region.
- Upside Reference: 0.70432.
- Invalidation: 0.68941.
- Next Expected Move: Corrective fluctuation followed by potential upside.
Trader's Question: Does exceeding the 50% retracement weaken the recovery outlook?
Not automatically. The deeper correction changes the expected wave B depth, but the scenario remains viable unless its structural evidence deteriorates or the marked invalidation is breached.