
Key Points
- The updated Elliott Wave count places red wave A at the ending diagonal's peak.
- A deeper wave B retracement could precede another upward advance.
Australian Dollar Price
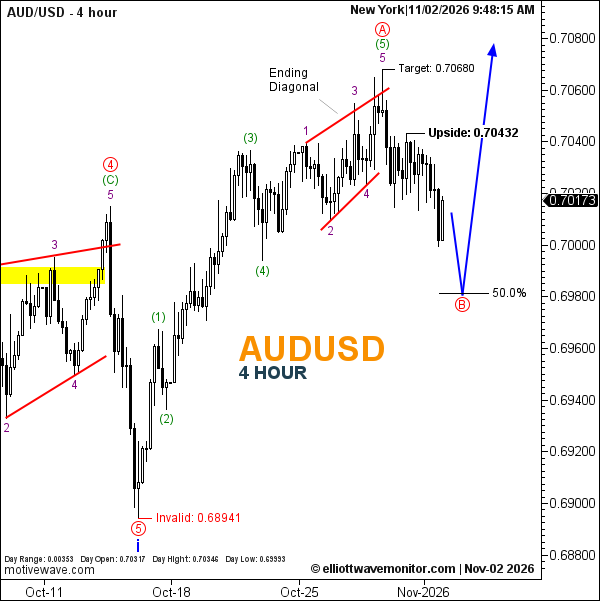
AUD/USD stood at 0.70173 at 9:48 a.m. New York time. The four-hour chart records a daily high of 0.70346 and low of 0.69933, against an opening price of 0.70317.
AUDUSD Elliott Wave Analysis
The retreat anticipated in the October 30 AUD/USD outlook has extended beyond its initial downside reference, shifting attention toward a potentially deeper corrective phase.
The latest count identifies an ending diagonal culminating provisionally in purple wave 5, green wave (5), and red wave A. Although 0.70680 remains the marked peak target, its precise achievement is unverified.
The blue projection now points toward red wave B near the 50% Fibonacci retracement around 0.6980, followed by renewed upside. The 0.70432 reference provides an intermediate level to monitor during any recovery.
Technical Analysis for November 2, 2026
- Trend: Corrective decline after the preceding advance.
- Wave Structure: Ending diagonal; red A provisionally labeled.
- Projected Wave B: Approximately 0.6980, near 50% retracement.
- Upside Reference: 0.70432.
- Invalidation: 0.68941.
Trader's Question: Must wave B reach the 50% retracement?
No. The Fibonacci level is a projected destination, not a mandatory turning point. Wave B could conclude earlier or extend further without reaching an exact price.