
Bitcoin (BTC/USD) maintains a bearish outlook on the 4-hour chart, trading near 81,381.60 after retreating from 84,849.70. The Elliott Wave count identifies wave W completed at 79,690.25, followed by an (a)-(b)-(c) recovery forming wave X. Renewed selling pressure and the failure to sustain the rebound favor another downward phase. Compared with October 22, the bearish outlook remains intact, although price has not yet broken the previous W low. The blue projection suggests a temporary recovery toward approximately 83,000 before a decline toward 79,000. A sustained move above the annotated 84,849.70 invalidation level would undermine the immediate bearish scenario.
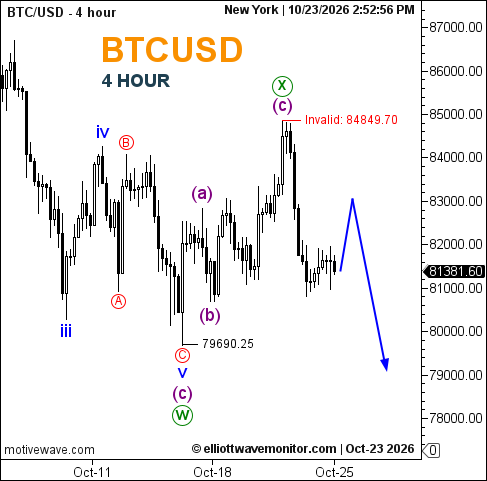
Technical Summary of Bitcoin Price for October 23, 2026
-
Trend: Bearish
-
Daily Support Levels: 81,000 (approximate intraday reference); 79,690.25 (annotated low).
-
Daily Resistance Levels: 83,000 (projected); 84,849.70 (invalidation).
-
Elliott Wave Patterns: Wave W completed at 79,690.25; corrective (a)-(b)-(c) recovery labeled X; another bearish leg projected.
-
Projected downside zone 79,000–79,690.25.
Trader's Question: Has Bitcoin completed wave X and begun another bearish phase?
The wave X labeling and subsequent retreat support that possibility, but a sustained break below 79,690.25 would provide stronger confirmation.