
Key Points
- Bitcoin's decline has approached the yellow support zone near $62,200.
- A developing second-wave recovery points toward the 61.8% Fibonacci retracement.
- Further selling remains projected after the corrective rebound.
Bitcoin Price
BTCUSD stood at $63,735.3 at 10:15 a.m. London time, approximately $370 below the November 17 chart observation. The difference represents two separate snapshots, not an official daily return.
Bitcoin Elliott Wave Analysis
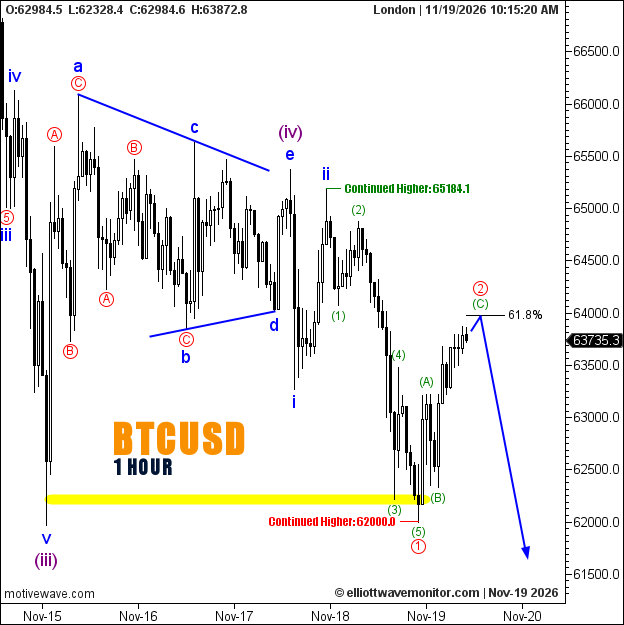
The bearish development anticipated in EWM's November 17 Bitcoin forecast has progressed toward the marked support area, without confirming a break beneath the earlier $61,970.3 trough.
The updated hourly count identifies purple wave (iv) as a completed triangle, followed by blue waves i and ii. A subsequent five-wave decline establishes red wave ① provisionally near support.
The latest recovery is developing through green corrective subdivisions. Wave (C) remains projected toward Fibonacci 61.8%, near $64,000, potentially completing red wave ② before another bearish extension.
Technical Analysis — November 19, 2026
- Trend: Bearish, H1.
- Structure: Red ② corrective recovery.
- Support: Yellow zone near $62,200.
- Fibonacci: 61.8%, approximately $64,000.
- Upside continuation: $65,184.1.
Trader's Question: Must Bitcoin reach the 61.8% retracement before declining again?
No. Fibonacci marks a potential corrective objective, not a required destination. The wave structure and subsequent price behavior remain decisive.