
Key Points
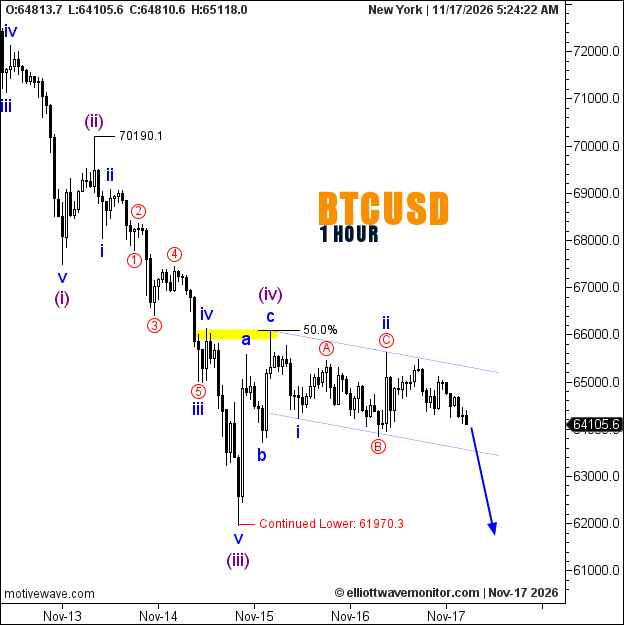
- Purple wave (iv) is provisionally complete near the 50% Fibonacci resistance area.
- The hourly chart now identifies blue waves i and ii within the subsequent decline.
- Bitcoin remains inside a descending channel, with further downside projected.
Bitcoin Price
BTCUSD was marked at $64,105.6 at 5:24 a.m. New York time, $1,460.2 below the November 15 report's price observation. This reflects two separate chart snapshots, not an official daily return.
Bitcoin Elliott Wave Analysis
The corrective recovery outlined in EWM's November 15 Bitcoin Elliott Wave assessment has developed into a provisional fourth-wave completion near the yellow 50% retracement zone.
Subsequent trading has established a descending channel, with blue wave i followed by wave ii and its red A-B-C subdivisions. The latest candles have moved back toward the channel's lower boundary, strengthening the case for bearish continuation without confirming a breakout.
The projected extension points lower, but a move beneath the previously established $61,970.3 trough remains unconfirmed.
Technical Analysis — November 17, 2026
- Trend: Bearish, H1.
- Structure: Purple (iv) provisionally complete; blue i–ii identified.
- Resistance: Yellow Fibonacci 50% zone.
- Confirmation: Lower-channel breakdown, followed by a break beneath $61,970.3.
Trader's Question: Is $61,970.3 already a confirmed downside target?
It is an existing wave low, not a newly achieved target. Trading below it would establish a fresh trough and provide stronger evidence of bearish continuation.