
Bitcoin is shown at 82,377.20 on the four-hour chart, recovering from 79,690.25, where the count marks W complete. The rebound is labelled (a)–(b)–(c) within corrective wave X. With (a) and (b) marked, the projected (c) could lift price toward approximately 83,700 before renewed weakness toward 78,300. Neither projected move is complete. Breaking 79,690.25 would support bearish continuation; exceeding 84,261.95 would weaken the illustrated rebound-then-decline scenario.
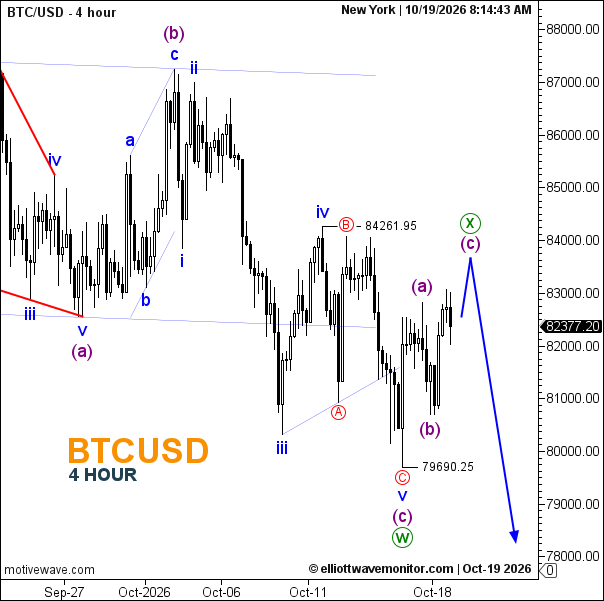
- Trend: Corrective rally within a broader bearish structure.
- Trading Range: Broad visible boundaries at 79,690.25–84,261.95.
- Wave Structure: W labelled complete; X developing through (a)–(b)–(c).
- Support: Approximately 80,500, then 79,690.25.
- Resistance: Around 83,700, followed by 84,261.95.