
Bitcoin’s four-hour chart shows 82,497.60 versus yesterday’s 82,377.20, with 79,690.25 still intact. Corrective wave X remains developing through (a)–(b)–(c); the projected (c) advance has not reached its endpoint. The updated path points toward approximately 84,400, above 84,261.95, before a potential decline toward 80,400. Crossing 84,261.95 would therefore fit an extended X rather than automatically invalidate the broader bearish interpretation.
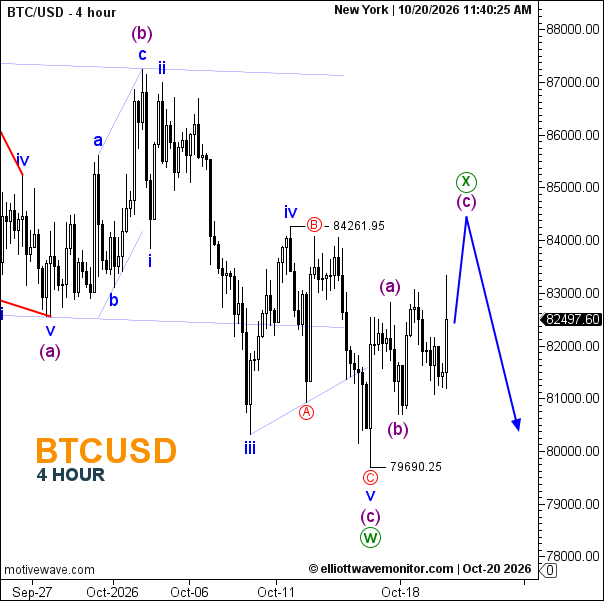
- Trend: Corrective recovery within a bearish structure.
- Trading Range: Approximately 80,700–83,400.
- Wave Structure: W labelled complete at 79,690.25; X remains unfinished.
- Support: Around 80,700, then 79,690.25.
- Resistance: 84,261.95; projected area near 84,400.
Will Bitcoin go up?
The count allows further recovery while the (b) low near 80,700 holds. Breaking that low would challenge the immediate (c) advance; losing 79,690.25 would support renewed downside.
BTCUSD News
U.S. spot Bitcoin ETFs attracted approximately $527 million in net inflows, providing a positive demand signal. However, one strong session does not establish a sustained recovery in investment appetite.
For the coming minutes and hours, the inflow news offers a modest bullish impulse for BTC, tempered by restrictive monetary conditions. September’s 3.7% U.S. inflation reading keeps further tightening relevant: higher expected interest rates increase the appeal of interest-bearing assets and can discourage speculative exposure.
An anticipated Fed hold at 3.75–4.00% would offer limited surprise. What matters next is whether ETF inflows persist and whether fresh policy signals alter expectations for additional hikes.