
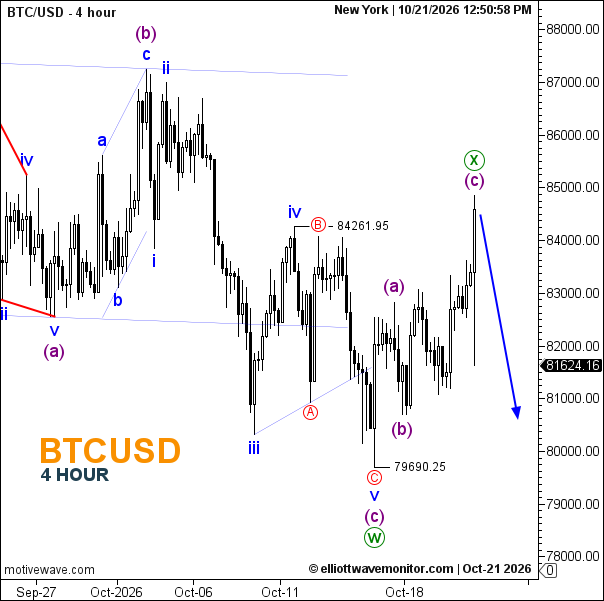
Bitcoin is at 81,624.16, down from 82,497.60 on October 20. The chart marks wave W complete at 79,690.25 and shows wave X’s (c) leg reaching approximately 84,800, above the earlier 84,261.95 reference. Wave X now appears complete, with a further decline projected toward approximately 80,600. That target is a chart projection, not a confirmed level.
- Trend: Bearish near term after the corrective rebound.
- Trading Range: 79,690–approximately 84,800.
- Wave Structure: W is complete; X appears complete near 84,800.
- Support: Approximately 80,600, then 79,690.25.
- Resistance: 84,261.95 and approximately 84,800.
Will Bitcoin go up? The chart favors a further decline toward 80,600; a recovery above 84,800 would challenge this short-term outlook.