
Bitcoin (BTC/USD) maintains a bearish short-term outlook on the 4-hour chart after retreating from 84,849.70, marked as wave (c) and X. The decline has pushed prices toward 81,624.16, reinforcing selling pressure following the corrective rebound from 79,690.25, labeled wave (c), v, and W. The Elliott Wave structure suggests that the X-wave recovery may have ended, opening the possibility of another downward sequence. The projected blue arrow supports a bearish continuation scenario toward the 80,000 region and potentially 79,690.25. A recovery above 84,849.70 would weaken this immediate bearish interpretation.
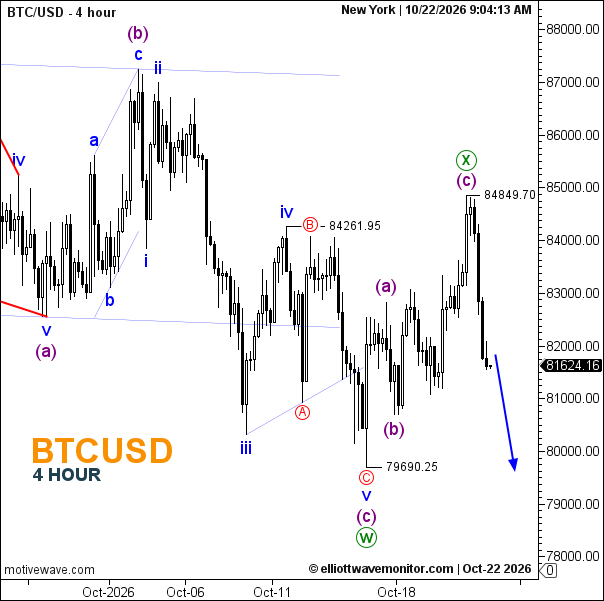
- Trend: Bearish
-
Key Support: 80,000; 79,690.25
-
Key Resistance: 84,261.95; 84,849.70
-
Trading Range: 80,000; 85,000; projected downside zone 80,000–79,690.25.
Has Bitcoin completed its corrective rebound?
The X-wave label at 84,849.70 suggests completion, but confirmation requires further bearish progression toward 79,690.25.