
Key Points
- USOilSpot has retreated following its fourth-wave recovery.
- Red wave 4 is now labeled near the 38.2% Fibonacci retracement.
- Further downside remains projected, with invalidation unchanged at $97.890.
Crude Oil Price: USOilSpot traded at $87.415 at 7:08 a.m. New York time. The four-hour chart records a daily high of $90.329 and low of $86.016, against an opening price of $87.425.
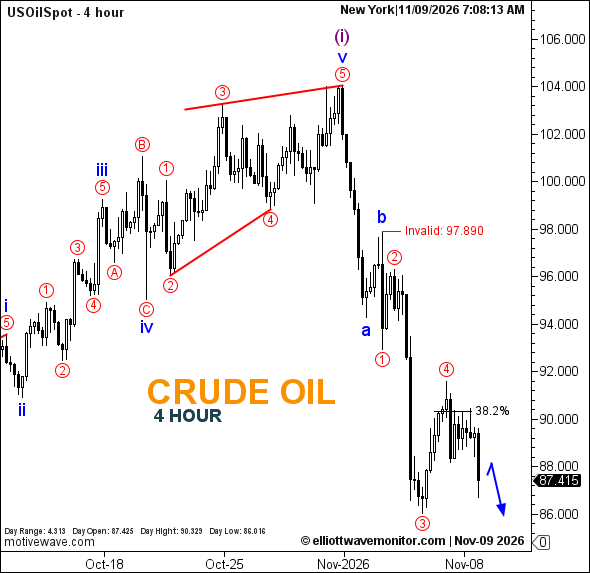
Crude Oil Elliott Wave Analysis
The corrective recovery anticipated in the November 5 crude oil and silver outlook has developed into a labeled fourth-wave peak, followed by renewed downward price movement.
The updated count places red wave 4 near the 38.2% Fibonacci retracement, following the earlier third-wave decline.
Although selling has resumed, the displayed $86.016 session low does not establish a new break beneath the low documented in that analysis.
The blue projection allows a limited rebound before another downward extension. The proposed decline remains conditional, with no exact final downside target specified.
Technical Analysis for November 9, 2026
- Trend: Bearish.
- Wave Structure: Red 4 provisionally complete.
- Fibonacci: 38.2% retracement region.
- Downside Reference: $86.016.
- Invalidation: $97.890.
Trader's Question: What would strengthen the bearish continuation scenario?
A sustained move below $86.016 would provide additional downside evidence, although confirmation of the broader wave structure would still require further price development.