Key Points
- Crude oil exceeded its previous upside-continuation reference of 87.609 during the day, but the new 88.245 threshold remains untested.
- Silver recorded a lower daily trough at 49.592, extending its bearish development without reaching the 48.589 downside-continuation level.
- The forecasts remain distinct: further recovery is projected for USOilSpot, while XAGUSD retains a three-stage corrective and bearish sequence.
Crude oil's recovery has made measurable progress within the Elliott Wave structure established on November 12. The USOilSpot four-hour chart recorded a daily high of 88.226, exceeding the 87.609 upside reference discussed in the previous crude oil analysis. Yet at 8:23:07 a.m. New York time on November 13, the displayed price was 87.519, below that earlier threshold, making a sustained breakout unconfirmed.
The wave count retains the provisional termination of red B, alongside green c and purple (v), following the earlier red A peak. With that structure unchanged, the blue forecast arrow projects further recovery. The new 88.245 marker is explicitly designated Continue Higher, while 83.054 remains the downside-continuation condition. Neither level is identified as a formal invalidation, and the chart provides no final numerical upside target.
![USOilSpot H4 CHART — NOVEMBER 13, 2026]](/media/library/2026/11/USOilSpot_-_Analysis_-_Nov-13_1523_PM_4_hour.png)
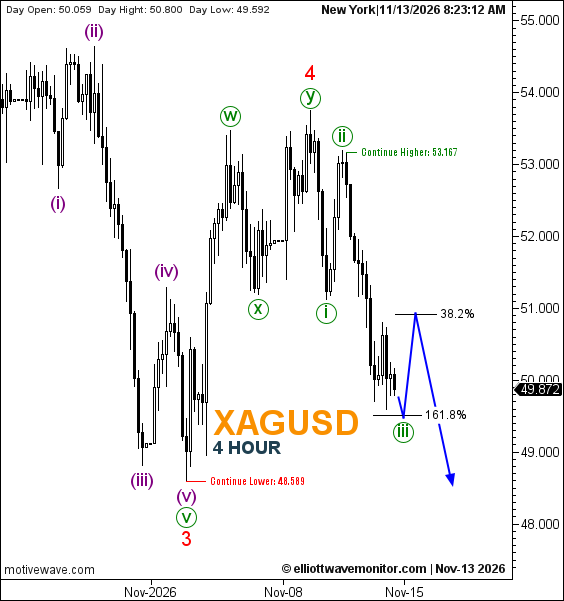
Silver's development is more firmly aligned with the declining structure introduced in the November 12 XAGUSD assessment. Its new four-hour chart shows a daily low of 49.592, below the previous day's 49.700, while the displayed price at 8:23:12 a.m. New York time was 49.872.
The count preserves the completed red wave 4 following green w–x–y, and the subsequent green waves (i) and (ii). From the last observed candles, the connected blue path anticipates three successive stages: a decline to complete green (iii) near the 161.8% Fibonacci extension, a corrective recovery toward 38.2%, and then another downward move. None of these prospective stages is confirmed complete.
Technical Outlook — H4
| Instrument | Next projected development | Continue Higher | Continue Lower |
|---|---|---|---|
| USOilSpot | Extension of the recovery following red B | 88.245 | 83.054 |
| XAGUSD | Green (iii) decline toward 161.8%, rebound toward 38.2%, then another decline | 53.167 | 48.589 |
Trader's Question: Has either chart confirmed the next major leg?
Answer: Not fully. Oil has surpassed its previous upside reference intraday but remains below the newly marked 88.245 level. Silver's lower low supports the bearish progression, yet its 48.589 downside-continuation condition and projected Fibonacci sequence remain unresolved.