
Key Points
- US30 exceeded the previous 52,976 invalidation level, requiring a revised Elliott Wave count.
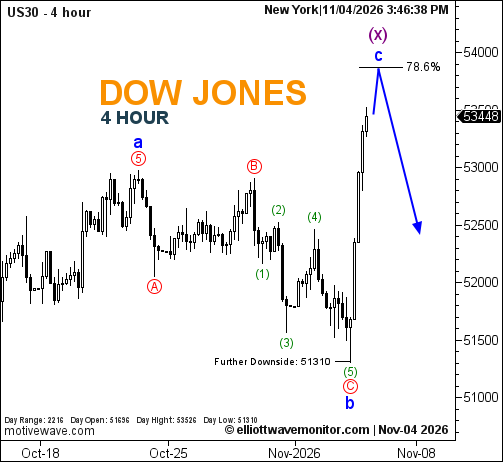
- The latest structure places blue wave b at the 51,310 low.
- A further advance toward the 78.6% Fibonacci retracement could precede renewed weakness.
Dow Jones Price: US30 traded at 53,448 at 3:46 p.m. New York time. The four-hour chart records an intraday high of 53,526 and low of 51,310, against an opening level of 51,693.
Dow Jones Elliott Wave Analysis
The recovery has moved beyond the invalidation boundary established in the November 2 Dow Jones forecast, prompting a substantive reassessment of the bearish wave structure.
The revised count identifies blue wave b at the latest structural trough, coinciding with red wave C and green wave (5).
The subsequent recovery shifts attention toward blue wave c, which is projected to complete purple wave (x) near the 78.6% Fibonacci retracement.
A bearish reversal is anticipated afterward, although neither the projected wave completion nor the subsequent decline has been confirmed.
Technical Analysis for November 4, 2026
- Structure: Blue b provisionally complete; c projected.
- Fibonacci: 78.6% retracement.
- Structural Low: 51,310.
Trader's Question: Would reaching the 78.6% retracement confirm a bearish reversal?
No. The Fibonacci level marks a potential corrective destination. Confirmation would require subsequent price action consistent with the proposed downward reversal.