
Price action: US30 is at 52,293, down 0.62% from the day open of 52,618. The displayed high is 52,908 and the low is 52,220, giving a current intraday range of 688 points. The high came within 68 points of the marked invalidation level at 52,976, but did not reach it. These are intraday figures and may change before the session closes.
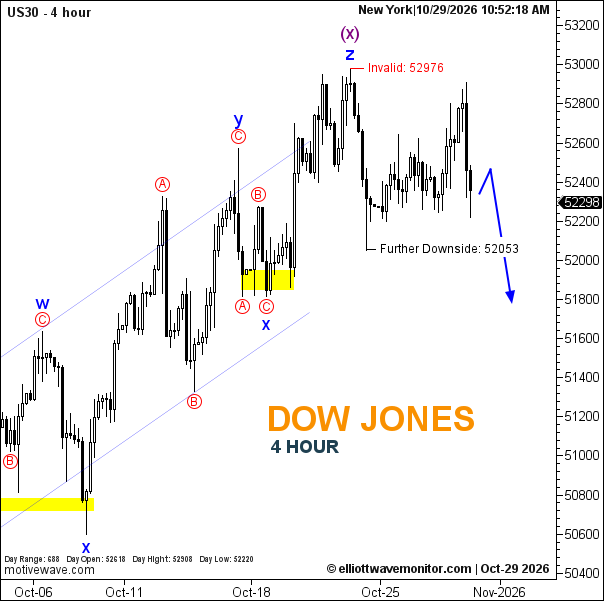
Elliott Wave analysis: The October 28 report described a corrective rebound beneath resistance and projected renewed selling toward 52,053. Since its reported price of 52,510, US30 has pulled back to 52,293. Today’s chart retains the blue W-X-Y-X-Z structure, with blue Z and purple (x) marked at the recent peak. The blue projection allows a short rebound before further downside toward the labeled 52,053 area. That target has not yet been reached, so the projected decline remains incomplete. The marked 52,976 invalidation level is unchanged.
Technical Summary
- Trend: Bearish corrective outlook
- Current Elliott Wave: Blue W-X-Y-X-Z structure; blue Z and purple (x) marked at the peak
- Key Support Levels: 52,053; highlighted area near 51,800–52,000
- Key Resistance / Invalidation: 52,976
- Next Price Target: 52,053
Q: Has US30 reached the projected downside target?
A: No. It is at 52,293, still above the labeled 52,053 target.