
Key Points
- The Dow Jones extended below the previous 51,672 downside reference.
- Green wave (1) is labeled at the latest structural low.
- A corrective recovery could precede another bearish extension.
Dow Jones Price
US30 traded at 52,314 at 11:17 a.m. New York time, above its daily opening level of 51,802. The four-hour chart records an intraday high of 52,465 and low of 51,792.
Dow Jones Elliott Wave Analysis
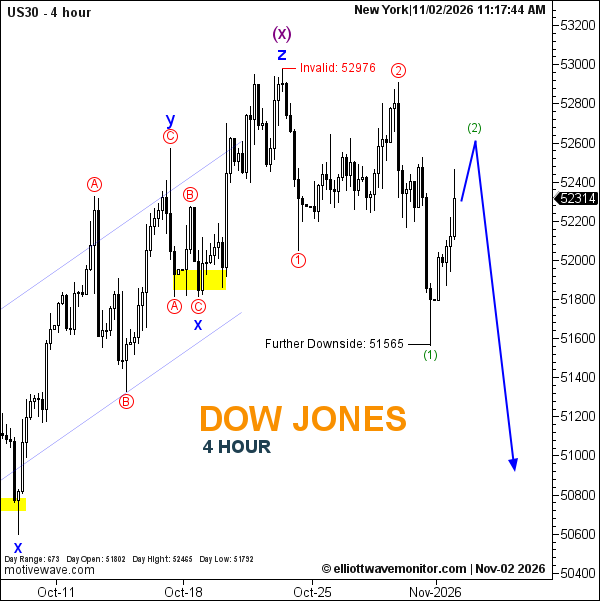
The Dow Jones has reached a significant point in the bearish sequence outlined in the October 30 U.S. index outlook, with the latest structural low extending to 51,565.
Following the completion of the earlier blue wave z and purple wave (x), the updated count now identifies green wave (1) at the recent trough.
Price has subsequently recovered, while the projected path anticipates further upside toward approximately 52,600 to develop green wave (2). This recovery would remain corrective within the prevailing bearish scenario.
A renewed decline is expected after the proposed second-wave completion, although the next downward extension remains unconfirmed.
Technical Analysis for November 2, 2026
- Trend: Bearish, with a corrective rebound.
- Wave Structure: Green (1) labeled; green (2) projected.
- Recorded Structural Low: 51,565.
- Projected Recovery: Approximately 52,600.
- Invalidation: 52,976.
Trader's Question: Would a recovery above 52,600 reverse the bearish outlook?
Not necessarily. The projected rebound is part of the corrective structure. The chart retains 52,976 as the explicit invalidation threshold.