
The four-hour chart shows Dow Jones at 51,855. Since October 16, price exceeded the highlighted resistance zone, formed the labelled C–y–(x) peak near 52,600, then reversed below it. This supports the proposed completion of the w–x–y correction, although further downside confirmation is needed. The projected path allows a brief rebound toward approximately 52,100 before a decline toward 51,200. Breaking 51,329 would strengthen that scenario; exceeding the (x) peak would challenge its proposed completion.
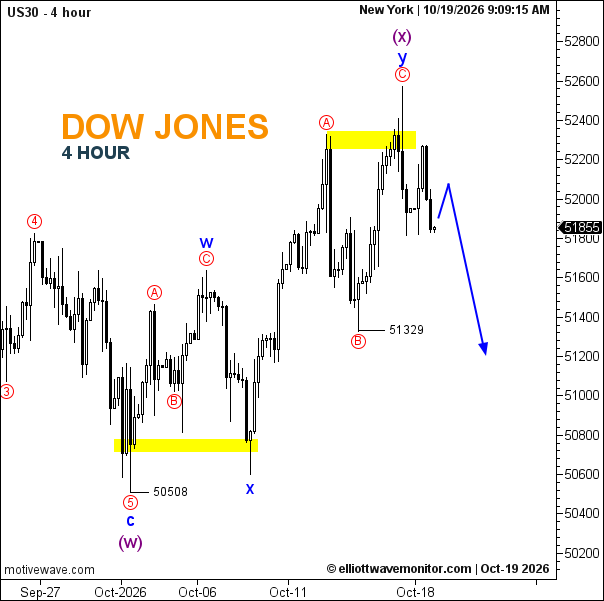
- Trend: Bearish reversal following a corrective rally.
- Trading Range: Broad boundaries at 51,329–approximately 52,600.
- Wave Structure: (w) ended at 50,508; w–x–y potentially completes (x).
- Support: 51,329, then 50,508.
- Resistance: Approximately 52,100, followed by the highlighted 52,250–52,350 zone.