
The Dow Jones stands at 52,564, above the 51,855 level in the October 19 chart. Price moved past the earlier rebound area near 52,100, while the projected drop toward 51,200 has not occurred. The updated chart now shows a possible advance toward 53,000, followed by a decline toward 51,500. This remains a projected corrective path; 51,814 is the marked nearby swing low.
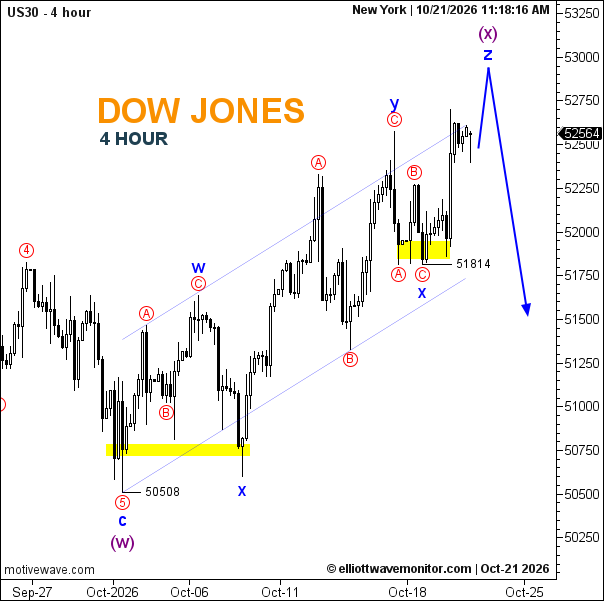
- Trend: Corrective advance, with a lower move projected after a possible peak.
- Trading Range: 51,814–approximately 53,000.
- Wave Structure: The chart projects an upswing marked (x)/Z, then a decline.
- Support: 51,814, then 50,508.
- Resistance: Approximately 52,700 and 53,000.
Is the Dow Jones going up or down? The chart allows for further near-term gains toward 53,000, then projects a decline; a break below 51,814 would add downside pressure.