
The Dow Jones (US30) has shifted toward a bearish short-term outlook, trading near 52,335 after retreating from the recent wave (x) and Z peak around 52,900. The Elliott Wave count preserves the completed W-X-Z structure, with the latest high suggesting a potential corrective termination. Price has fallen sharply from the upper region of the ascending channel, weakening the previous bullish momentum. Compared with October 22, the anticipated upward extension has been followed by a visible reversal. The blue projection allows a temporary rebound toward 52,500 before renewed selling pressure potentially drives the index toward 51,350. The annotated 51,814 level remains an important structural support reference, while a sustained recovery above the recent peak would challenge the bearish outlook.
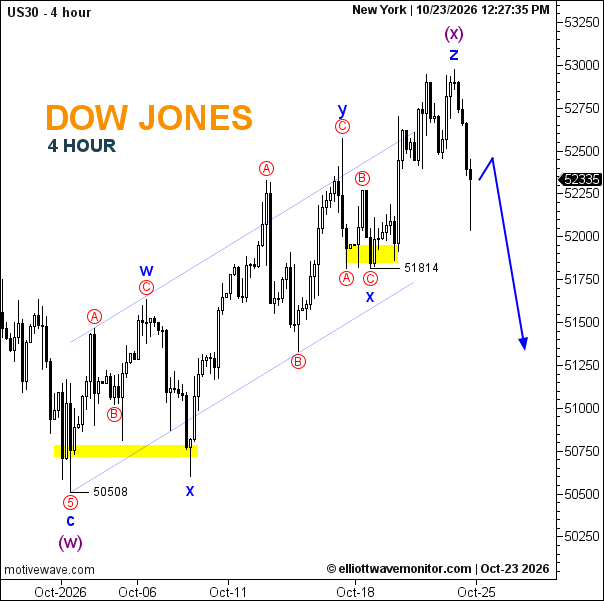
Technical Summary of Dow Jones Price for October 23, 2026
-
Trend: Bearish
-
Daily Support Levels: 52,000 (approximate); 51,814 (annotated); 51,350 (projected).
-
Daily Resistance Levels: 52,500 (projected); 52,900 (approximate recent peak).
-
Elliott Wave Patterns: W-X-Z corrective structure, with wave Z and (x) labeled at the recent peak; a bearish reversal is projected.
-
Projected downside zone 51,350–51,814.
Trader's Question: Has the Dow Jones completed its corrective advance and started a bearish reversal?
The wave Z/(x) labeling and sharp retreat favor that possibility, but a sustained breakdown below 51,814 would provide stronger confirmation.