
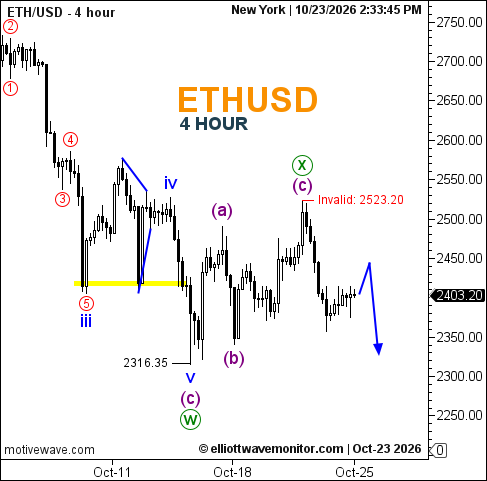
Ethereum (ETH/USD) maintains a bearish outlook on the 4-hour chart, trading near 2,403.20 after retreating from the corrective wave X peak, labeled (c), near 2,523.20. The Elliott Wave count identifies wave W completed at 2,316.35, followed by an (a)-(b)-(c) recovery forming wave X. Renewed selling pressure supports a potential downward continuation, although price remains above the previous W low. Compared with October 22, the bearish scenario remains intact, with the latest chart introducing an explicit invalidation level at 2,523.20. The blue projection suggests a temporary rebound toward approximately 2,440–2,450 before another decline toward 2,330–2,350. A sustained move above 2,523.20 would invalidate the annotated bearish setup.
Technical Summary of Ethereum Price for October 23, 2026
-
Trend: Bearish
-
Daily Support Levels: 2,400 (approximate); 2,316.35 (annotated historical low).
-
Daily Resistance Levels: 2,450 (projected); 2,523.20 (invalidation).
-
Elliott Wave Patterns: Completed wave W at 2,316.35; corrective (a)-(b)-(c) recovery labeled X; subsequent bearish continuation projected.
-
Projected downside zone 2,330–2,350.
Trader's Question: Has Ethereum completed wave X and begun another downward phase?
The labeled wave X peak and subsequent retreat support that interpretation, but a sustained decline below 2,316.35 would provide stronger confirmation.