
Key Points
- The latest wave count provisionally marks the completion of red wave ④.
- Green waves (A), (B), and (C) define the corrective recovery.
- A fifth-wave decline remains projected, rather than confirmed.
Ethereum Price
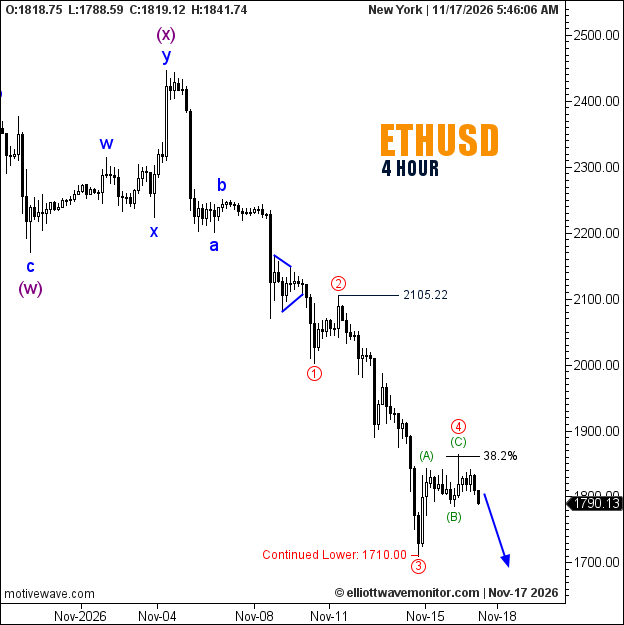
ETHUSD's four-hour chart shows $1,790.13 at 5:46 a.m. New York time, $45.73 below the November 15 observation of $1,835.86. This is a comparison between two chart snapshots, not an official daily percentage change.
Ethereum Elliott Wave Analysis
Ethereum's corrective recovery has developed beyond the stage described in EWM's November 15 Ethereum price outlook, when completion of the fourth wave remained uncertain.
The updated chart now places red wave ④ at the termination of green wave (C), following an (A)–(B)–(C) recovery toward the 38.2% Fibonacci retracement.
Recent candles have retreated from that corrective high, supporting the prospect of renewed weakness. Nevertheless, the blue downward projection remains a forecast, and the previously established $1,710.00 trough has not been breached.
Technical Analysis — November 17, 2026
- Trend: Bearish, H4.
- Wave structure: Red ④ provisionally complete.
- Fibonacci: 38.2% corrective reference.
- Downside confirmation: Break below $1,710.00.
Trader's Question: Does the marked fourth-wave peak confirm that wave ⑤ has begun?
Not conclusively. The count favors that interpretation, but further downside development is needed to distinguish a sustained fifth-wave decline from a temporary retreat.