
Key Points
- Ethereum extended its third-wave decline to a fresh low.
- A fourth-wave recovery is testing the 38.2% Fibonacci retracement area.
- The broader bearish outlook continues to favor another downward leg.
Ethereum Price
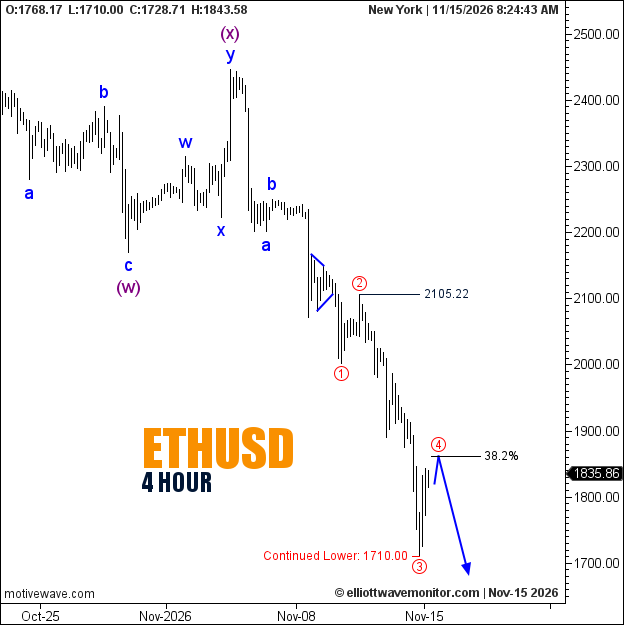
ETHUSD was quoted at $1,835.86 on the four-hour chart captured at 8:24 a.m. New York time, following a decline to $1,710.00 and a subsequent recovery.
Ethereum Technical Analysis
Ethereum's selling pressure has intensified since the November 14 price analysis, with the red third wave extending beyond the previously marked $1,815.92 low.
The latest rebound introduces a different phase of the same bearish structure. Red wave 4 is now positioned near the 38.2% Fibonacci retracement, suggesting that the recovery may be corrective rather than the beginning of a sustained reversal.
The projected path subsequently points lower, potentially allowing red wave 5 to develop. However, completion of the fourth-wave rebound remains unconfirmed, and the chart provides no explicit invalidation level.
Technical Analysis — November 15, 2026
- Trend: Bearish, H4.
- Wave Structure: Red wave 4 following wave 3.
- New Low: $1,710.00.
- Fibonacci: 38.2% retracement.
- Outlook: Potential fifth-wave decline.
Trader's Question: Would a move above the Fibonacci retracement invalidate the bearish forecast?
Not automatically. The retracement is a corrective reference, not a formal invalidation threshold. A stronger structural change would be needed to challenge the existing wave interpretation.