
Ethereum’s four-hour chart shows 2,422.20 after a rebound from 2,316.35, labelled as the completion of W. Corrective wave X is developing through (a)–(b)–(c). The projected (c) could extend toward approximately 2,540 before renewed weakness toward 2,260. These moves remain prospective. Breaking 2,316.35 would support bearish continuation.
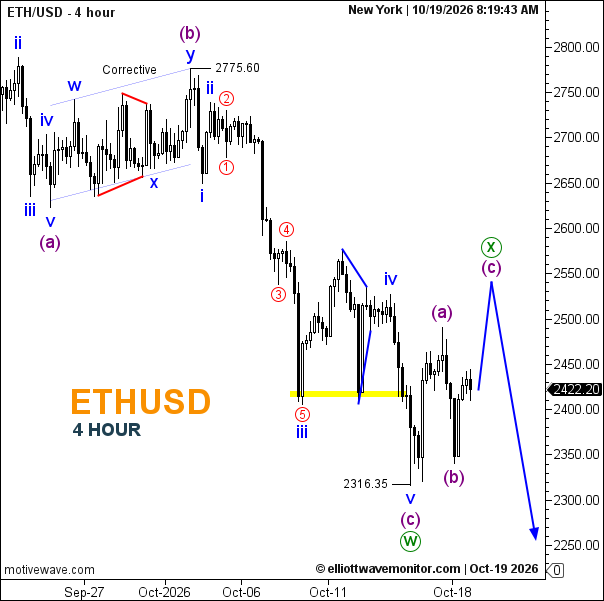
- Trend: Corrective rebound within a bearish structure.
- Trading Range: Approximately 2,316.35–2,490.
- Wave Structure: W labelled complete; X developing as (a)–(b)–(c).
- Support: Around 2,340, then 2,316.35.
- Resistance: Around 2,490; projected rebound area near 2,540.
Is Ethereum a buy or sell today?
The chart favours a corrective rebound followed by downside risk. A break below the (b) low would weaken the immediate upside projection; sustained strength beyond 2,540 would require reassessing the projected reversal.