
Ethereum is at 2,508.55, up from 2,468.10 on October 20. The rebound from the marked 2,316.35 low is extending beyond yesterday’s projected 2,540 area. The chart now allows for wave X to continue toward approximately 2,620 before a possible decline toward 2,400. Both legs remain projected; the broader structure is still corrective.
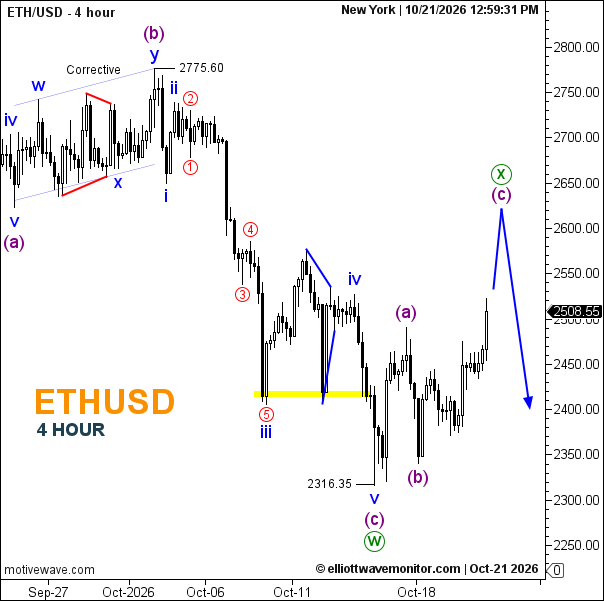
- Trend: Corrective rebound, with a later decline projected.
- Trading Range: Approximately 2,316–2,620.
- Wave Structure: W is marked complete; X may extend toward 2,620.
- Support: 2,410–2,420, then 2,316.35.
- Resistance: Approximately 2,540 and 2,620.
Is Ethereum a buy or sell today? The chart favors a further rebound toward 2,620, followed by downside risk toward 2,400; it does not confirm either move yet.