
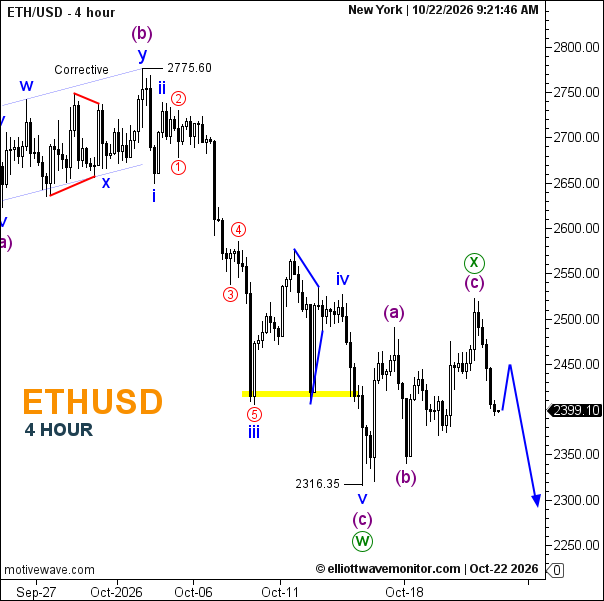
Ethereum (ETH/USD) maintains a bearish outlook on the 4-hour chart, trading near 2,399.10 after retreating from the corrective wave X peak around 2,500. The Elliott Wave structure identifies the preceding decline from 2,775.60 to 2,316.35 as wave (c), completing wave W. The subsequent (a)-(b)-(c) recovery is labeled wave X, suggesting another downward phase may develop. Recent selling pressure and the failure to sustain the rebound support this scenario. The projected blue path allows a temporary recovery toward 2,450 before renewed weakness toward 2,300. A sustained move above the X-wave high near 2,500 would challenge the immediate bearish outlook.
-
Trend: Bearish
-
Key Support: 2,400 (approximate); 2,316.35
-
Key Resistance: 2,450; 2,500 (approximate)
-
Projected downside zone 2,300–2,316.35.
Is Ethereum beginning another downward Elliott Wave sequence?
The completed X-wave labeling and renewed selling pressure favor further weakness, although a short-term rebound remains possible before a test of 2,316.35.