Key Points
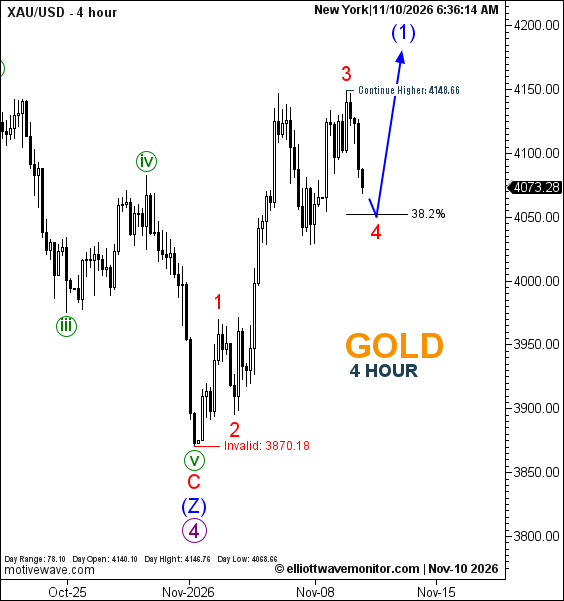
- The four-hour count places red wave 3 at the recent high and projects a red wave 4 decline toward the 38.2% Fibonacci retracement before another advance.
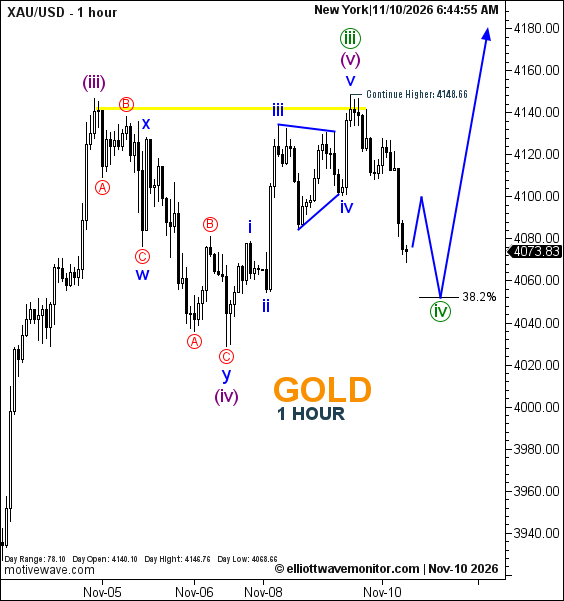
- The hourly chart marks green wave (iii) at the latest peak. Its blue forecast path anticipates a brief rebound, further correction toward green (iv), and then renewed upside.
- 4,148.66 is an upside-continuation reference on both charts; 3,870.18 is an invalidation level on H4 only.
Gold's two November 10 charts place a corrective phase between the recent advance and a possible next upward leg, but they describe different wave degrees and should not be treated as identical counts. The four-hour XAUUSD snapshot displayed 4,073.28 at 6:36:14 a.m. New York time. Eight minutes later, the one-hour chart displayed 4,073.83 at 6:44:55 a.m. Both show a daily high of 4,146.76, low of 4,068.66, and opening figure of 4,140.10. These are source-chart observations, not live quotes.
Four-hour structure: a fourth wave still ahead
The H4 count identifies an earlier correction ending at the overlapping purple 4, blue (Z), red C, and green v labels. The subsequent recovery developed through red waves 1 and 2 toward the recent red 3 high. Price has since retreated, while the connected blue line projects, rather than documents, a continuation down to red wave 4 near the 38.2% retracement.
Only after that prospective completion does the plotted path turn higher toward blue wave (1). The chart labels 4,148.66 “Continue Higher” and 3,870.18 “Invalid”; neither the wave-4 retracement price nor the projected blue (1) endpoint is numerically specified.
One-hour development: the projected correction has stages
The more granular H1 sequence has moved beyond the stage described in the November 10 Tokyo-session H1 analysis, which still anticipated a final purple fifth-wave rise near a labeled yellow resistance zone.
The newer hourly drawing locates purple (v), blue v, and green (iii) at the recent peak, followed by a realized decline. Its single blue forecast path first rises modestly, then drops toward the 38.2% reference and anticipated green (iv), before pointing sharply upward.
That closing advance remains unobserved. 4,148.66 is marked as the continuation reference, but the H1 chart does not label a current invalidation; the earlier report's figure must not be carried forward automatically.
Technical Outlook — November 10, 2026
| Timeframe | Sequential forecast | Key conditions |
|---|---|---|
| H4 | Red wave 4 toward 38.2%, then rise toward blue (1) | Continuation 4,148.66; invalidation 3,870.18 |
| H1 | Small rebound, lower move toward green (iv) at 38.2%, then rise | Continuation 4,148.66; current invalidation not shown |
Trader's Question: Do the two 38.2% references confirm that the fourth-wave corrections have already ended?
Answer: No. Both are projected Fibonacci retracement waypoints, not confirmed reversal points. The charts retain separate wave degrees, and subsequent price action is needed to assess each proposed completion.