You hear that inflation has halved. Then you visit the supermarket and discover that your usual groceries cost more. Are the figures wrong, or have stores simply not caught up?
The inflation figures and your higher bill can both be correct. Falling inflation usually means prices are rising more slowly—not that they are falling. The distinction is between what something costs and how quickly that cost changes.
Your bill shows the price. Inflation measures the change.
Imagine a fixed basket of groceries, with quantities and quality unchanged, initially costing 100 currency units. These figures are hypothetical:
| Period | Annual increase in the basket’s price | Basket cost |
|---|---|---|
| Starting point | — | 100 |
| End of year one | 10% | 110 |
| End of year two | 5% | 115.50 |
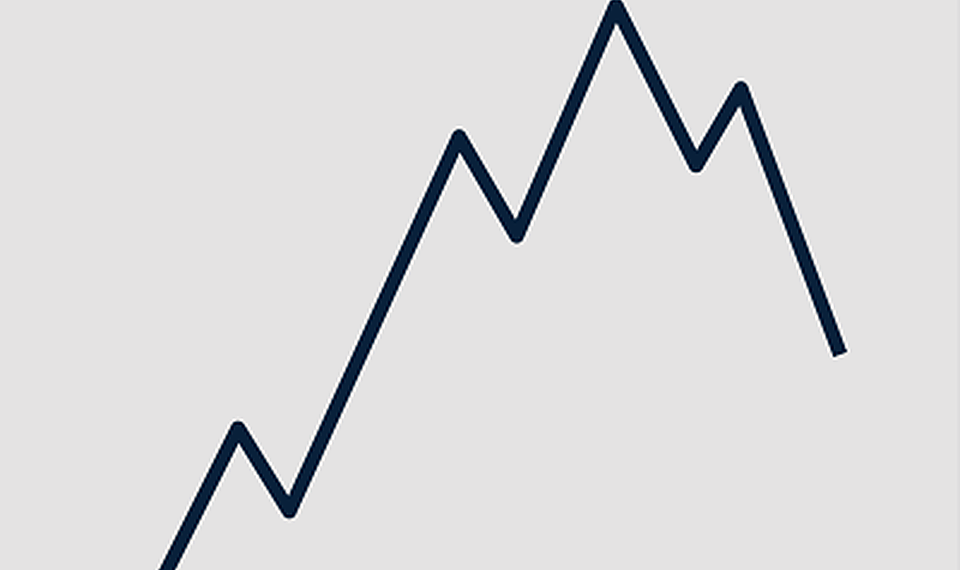
In the second year, the rate of price growth fell from 10% to 5%. Yet the basket became another 5.50 more expensive.
The 5% was not deducted from the bill. It was added to the new price of 110. The basket now costs 15.5% more than it did at the starting point, despite the slowdown in inflation.
Earlier increases do not disappear when inflation falls. They remain embedded in the price on which subsequent changes are calculated.
What would make prices actually fall?
Three different situations are often confused:
- Disinflation: The overall price level continues to rise, but at a slower rate.
- Zero inflation: The overall price level is unchanged over the comparison period, although individual prices can move in either direction.
- Deflation: The overall price level falls, producing a negative inflation rate.
A decline in tomato or petrol prices alone does not establish economy-wide deflation. Some goods can become cheaper while other goods and services become more expensive.
Even if overall price growth stops completely, that does not automatically restore the prices households paid years ago. It means prices have stopped increasing on average over the period being measured.
Why your groceries may rise faster than headline inflation
The basket behind the index is not your personal shopping basket. Consumer inflation is typically measured across a broad range of spending, including food, housing, transport and healthcare. Each category carries a weight reflecting its share of the expenditure represented by the index.
If transport inflation slows while food prices keep climbing rapidly, headline inflation can fall without a comparable improvement at the supermarket. A household that devotes more of its budget to food may experience different cost pressures from one with a different spending pattern.
Comparisons also need to account for quantity. If a package keeps the same price but shrinks from one kilogram to 900 grams, its price per kilogram has increased—even though the shelf label looks unchanged.
A lower annual rate can reflect what happened a year ago
Annual inflation compares today’s prices with their level 12 months earlier.
If the earlier comparison month contained a large price jump, annual inflation can fall as that jump drops out of the comparison, even while prices continue rising from month to month. This is known as a base effect.
When a headline says “inflation fell,” ask what is being compared. Has price growth slowed relative to the previous month or the previous year? Does the figure describe the overall basket or food specifically? Those distinctions determine what the number actually tells you.
Check your understanding
A fixed basket costs 200 currency units. Its price rises by 10% in one year and by 2% in the following year. Does it now cost 204, 220 or 224.40?
The answer is 224.40. The first increase takes the cost to 220. The second adds 2% to that amount. Price growth slowed sharply, but the basket continued getting more expensive.
To judge whether the bill has become easier to afford, also compare income growth with the changing cost of your needs. Your purchasing power can improve if your income grows faster than those costs, even without prices returning to their old levels.