
Key Points
- NAS100 established a lower trough at 27,511.80.
- The revised Elliott Wave count identifies red wave B at the latest low.
- A corrective rebound toward the 50% Fibonacci retracement could precede further weakness.
Nasdaq 100 Price: NAS100 traded at 28,503.18 at 4:01 p.m. New York time. The four-hour chart records a daily high of 28,862.80 and low of 27,511.80, against an opening level of 28,306.65.
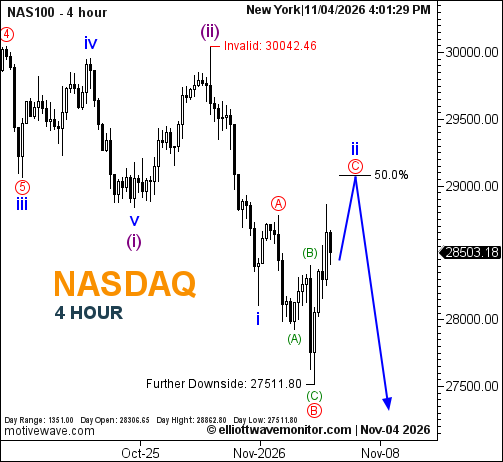
Nasdaq 100 Elliott Wave Analysis
The decline has extended beneath the structural low identified in the November 2 Nasdaq 100 forecast, prompting a revision to the internal wave count.
Rather than retaining the earlier red wave 1 interpretation, the updated structure places red wave B at the latest trough, incorporating green subdivisions (A), (B), and (C).
The projected recovery now favors red wave C completing blue wave ii near the 50% Fibonacci retracement. Another decline is subsequently anticipated, although neither projected movement has been confirmed.
Technical Analysis for November 4, 2026
- Trend: Bearish outlook with corrective recovery.
- Wave Structure: Red B provisionally complete; red C projected.
- Fibonacci: 50% retracement, approximately 29,100.
- Invalidation: 30,042.46.
Trader's Question: Would reaching the 50% retracement confirm another decline?
No. The Fibonacci level identifies a potential corrective destination. A subsequent bearish reversal would provide stronger evidence that blue wave ii has concluded.