
Price action: NAS100 is at 29,480.43, below the day open of 29,620.43, a decline of 0.47% since the open. The displayed day high is 29,660.93 and the low is 29,350.81, a current intraday range of 310.12 points; these figures may change before the session ends.
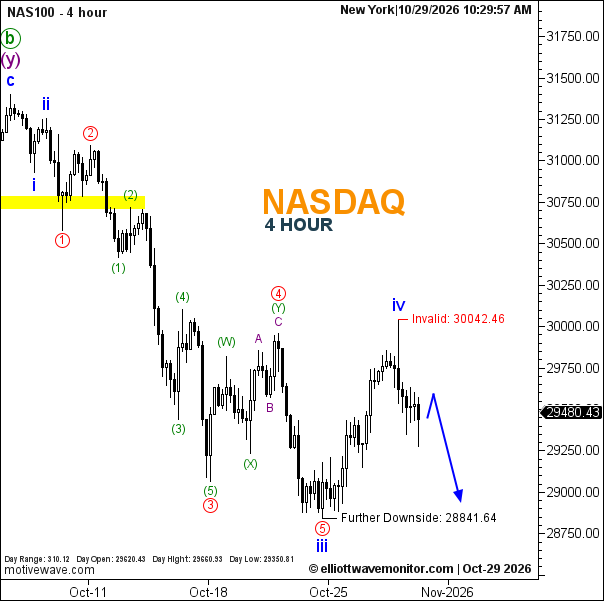
Elliott Wave analysis: The October 28 report described the recovery toward 29,682.43 as blue wave ii and kept the bearish scenario below 29,956.73. Today’s chart shows a different wave labeling: blue iii and blue iv are marked, and the drawn path projects a brief rise from the current area followed by further downside. The marked target remains 28,841.64, which has not yet been reached. The chart marks 30,042.46 as the invalidation level; the bearish projection remains in place below it. The projected path is not confirmation that the decline has resumed.
Technical Summary
- Trend: Bearish projection
- Current Elliott Wave: Blue iii and blue iv are labeled; further downside is projected.
- Key Support / Target: 28,841.64
- Invalidation Level: 30,042.46
Q: Is the NAS100 decline confirmed?
A: Not yet. The chart projects further downside toward 28,841.64, but that move remains pending.