
Key Points
- NAS100 recorded a low of 28,103.98, moving beneath the previously projected downside area.
- The updated Elliott Wave count identifies red wave 1 at the latest trough.
- A corrective rebound toward the 50% Fibonacci retracement may precede further weakness.
Nasdaq 100 Price
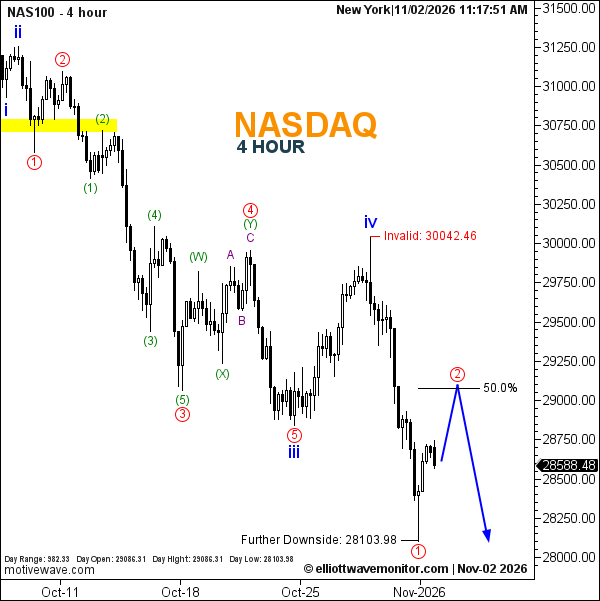
NAS100 stood at 28,588.48 at 11:17 a.m. New York time. The four-hour chart shows a daily opening price of 29,086.31 and a trading range of 982.33 points.
Nasdaq 100 Elliott Wave Analysis
The bearish structure has reached a significant milestone, with the latest low extending beneath the approximate 28,250 downside objective outlined in the October 30 U.S. index outlook.
Following the previously identified blue wave iv recovery, the updated count labels the subsequent decline as red wave 1.
Attention now turns toward a potential red wave 2 rebound near 29,100, corresponding approximately to the 50% Fibonacci retracement.
The blue projection subsequently favors another decline, although both the recovery and the following bearish extension remain unconfirmed.
Technical Analysis for November 2, 2026
- Trend: Bearish.
- Wave Structure: Red 1 labeled; red 2 projected.
- Recorded Low: 28,103.98.
- Fibonacci Retracement: 50%, near 29,100.
- Invalidation: 30,042.46.
Trader's Question: Does the higher current quote contradict the bearish scenario?
No. Although the latest quoted price exceeds October 30's reading, the new chart records a deeper low. Snapshot differences alone do not establish the intervening price sequence.