
The NASDAQ 100 maintains a bearish outlook on the 4-hour chart, trading near 29,102.06 after extending its decline to 28,877.31. The Elliott Wave count identifies the preceding five-wave decline ending at wave (i), followed by a W-X-Y correction labeled wave (ii). Renewed selling pressure below the previous 29,066.22 low strengthens the bearish continuation scenario. Compared with October 22, the anticipated decline has progressed, while the projected rebound remains unconfirmed. The blue path suggests a temporary recovery toward approximately 29,250 before another decline toward 28,800. The annotated 29,956.73 invalidation level remains critical; a sustained recovery above it would undermine the immediate bearish interpretation.
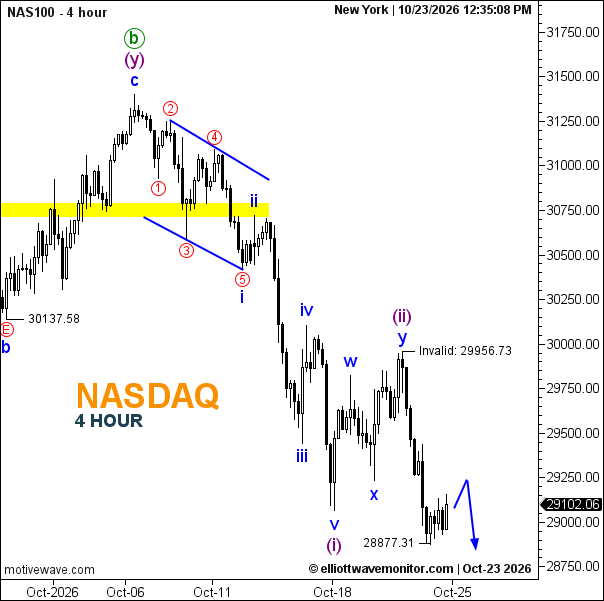
Technical Summary of NASDAQ 100 Price for October 23, 2026
-
Trend: Bearish
-
Daily Support Levels: 28,877.31 (annotated low); 28,800 (projected).
-
Daily Resistance Levels: 29,250 (projected); 29,956.73 (invalidation).
-
Elliott Wave Patterns: Completed five-wave decline labeled (i), followed by W-X-Y correction labeled (ii); renewed bearish continuation is projected.
-
Projected downside zone 28,800–28,877.31.
Trader's Question: Can the NASDAQ 100 extend its decline after a temporary rebound?
The bearish wave structure favors further weakness toward 28,800 following a possible rebound near 29,250, while recovery above 29,956.73 would challenge this outlook.