
Nasdaq’s four-hour chart shows 29,583.25. Since October 16, the decline extended to 29,066.22, now labelled v and the endpoint of (i). The revised count places the initial leading diagonal within i of (i). A corrective rebound in (ii) is projected toward approximately 30,300 before renewed weakness. Breaking 29,066.22 would support bearish continuation; exceeding 31,400.63 would invalidate the proposed wave (ii) recovery.
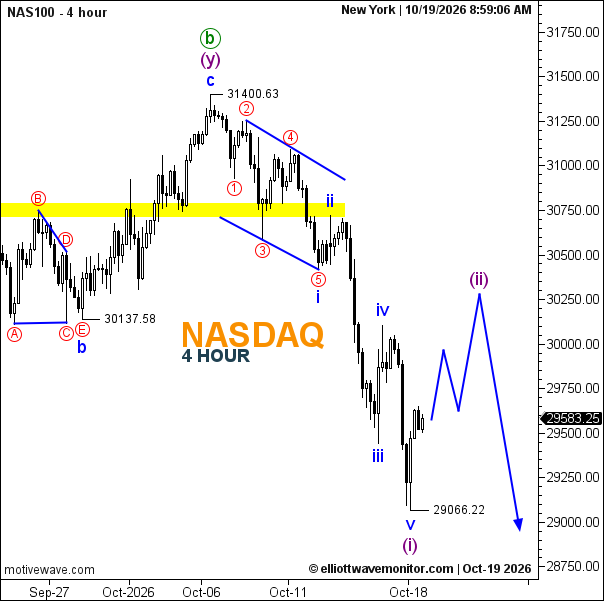
- Trend: Corrective rebound within a bearish structure.
- Trading Range: No established sideways range.
- Wave Structure: i–ii–iii–iv–v completes the proposed (i); (ii) developing.
- Support: 29,066.22.
- Resistance: Around 30,000, then the projected 30,300 area.
What is happening to Nasdaq now?
Nasdaq is recovering after a fresh low. The count treats this as a corrective bounce, with the broader bearish scenario still active below 31,400.63.