
Nasdaq is at 29,744.48, up from 29,583.25 on October 19. The chart keeps 29,066.22 as the low of wave (i). The rebound may be developing as wave (ii), with a projected rise toward approximately 30,250 before another decline toward 29,000. This remains a chart scenario; 31,400.63 is the marked reference for challenging the broader bearish count.
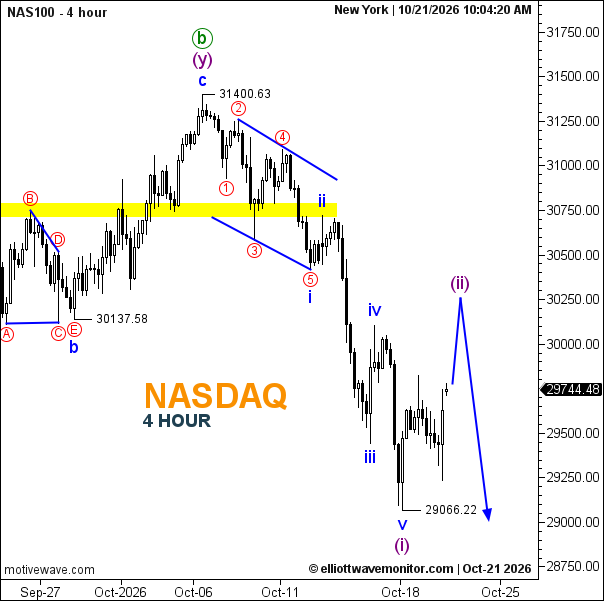
- Trend: Bearish structure with a corrective rebound.
- Trading Range: 29,066–approximately 30,250.
- Wave Structure: Wave (i) is marked complete; wave (ii) is developing.
- Support: 29,066.22.
- Resistance: Approximately 30,000–30,250.
What is happening to Nasdaq now? It is rebounding within a potential wave (ii); a turn lower near resistance would support the projected decline.