
Key Points
- SPX500 has adopted a revised Elliott Wave structure centered on green waves W and X.
- The corrective recovery is approaching the projected 61.8% Fibonacci retracement.
- Another bearish extension remains anticipated after the correction ends.
S&P 500 Price: SPX500 traded at 7,701.95 at 9:48 a.m. New York time. The four-hour chart records a daily high of 7,702.94 and low of 7,465.06, against an opening level of 7,582.35.
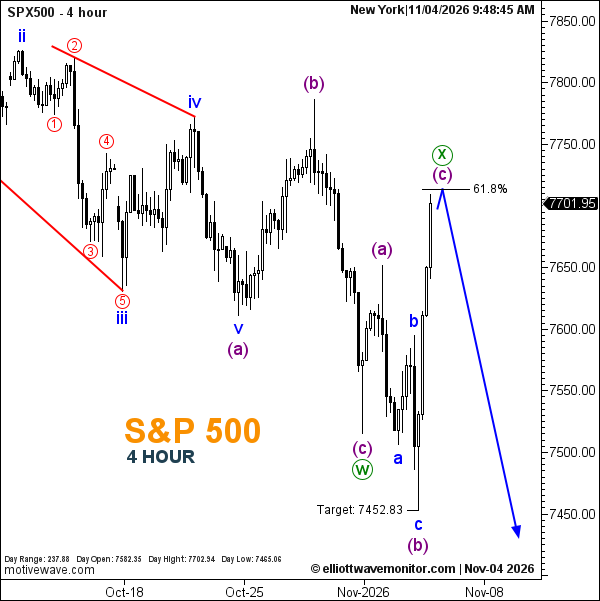
S&P 500 Elliott Wave Analysis
The rebound discussed in the November 2 S&P 500 analysis has extended beyond its earlier Fibonacci reference, prompting a reassessment of the wave structure.
The revised count identifies green wave W at the preceding corrective low. The subsequent recovery is now interpreted within the developing green wave X, with purple wave (c) projected toward the 61.8% retracement.
The blue forecast path anticipates another decline once this correction concludes. However, the turning point remains unconfirmed, and the chart provides no new explicit invalidation level.
Technical Analysis for November 4, 2026
- Trend: Bearish outlook with a corrective recovery.
- Wave Structure: Green W labeled; X projected.
- Fibonacci: 61.8% retracement.
- Downside Reference: 7,452.83, not confirmed reached.
Trader's Question: Does reaching the 61.8% retracement confirm another decline?
No. Fibonacci identifies a potential corrective destination. A subsequent bearish reversal would provide stronger evidence that wave X has concluded.