
Key Points
- SPX500 approached the previously projected downside region near 7,520.
- The updated count identifies blue wave (i) at the latest low.
- A rebound toward the 50% Fibonacci retracement could precede renewed selling.
S&P 500 Price
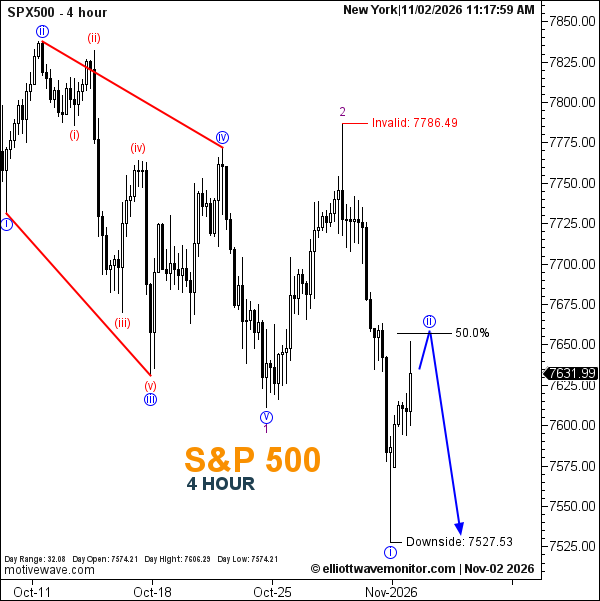
SPX500 displayed 7,631.99 at 11:17 a.m. New York time. The four-hour chart shows a recovery from the marked structural low, although its daily high and latest quote are inconsistent and require verification.
S&P 500 Elliott Wave Analysis
The bearish sequence has progressed toward the downside area anticipated in the October 30 U.S. index outlook.
The updated count places purple wave 2 at the preceding recovery peak, followed by a decline ending provisionally in blue wave (i).
Attention now shifts to the developing corrective recovery. The blue projection anticipates wave (ii) approaching the 50% Fibonacci retracement near 7,660 before another downward extension.
This projected reversal remains unconfirmed, while 7,786.49 defines the scenario's invalidation threshold.
Technical Analysis for November 2, 2026
- Trend: Bearish, with a corrective rebound.
- Wave Structure: Blue (i) labeled; blue (ii) projected.
- Structural Low: 7,527.53.
- Fibonacci Retracement: 50%, near 7,660.
- Invalidation: 7,786.49.
Trader's Question: Would a rebound beyond the 50% retracement invalidate the bearish count?
Not automatically. Fibonacci marks a potential corrective reference, while 7,786.49 remains the explicit invalidation level.