
S&P 500 Daily Price Action
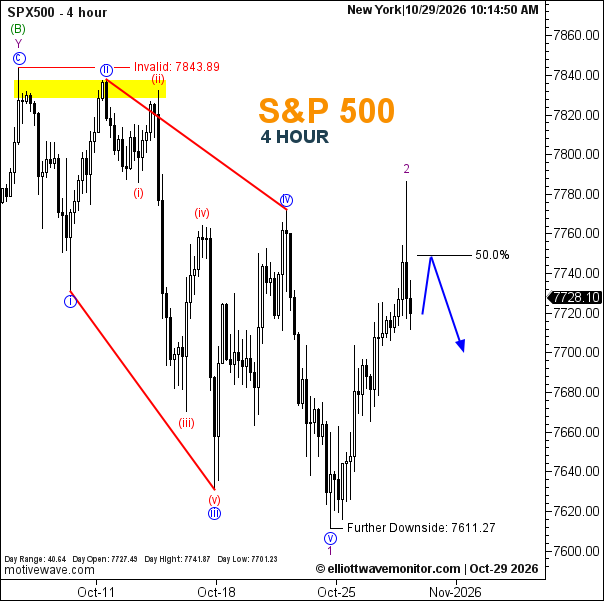
The S&P 500 is trading at 7,728.10, slightly above its daily opening level of 7,727.49, representing a gain of approximately 0.01% since the open. The index has fluctuated between an intraday high of 7,741.87 and a low of 7,701.23, producing a trading range of 40.64 points. Price remains below the marked 50.0% Fibonacci retracement near 7,750.
S&P 500 Elliott Wave Analysis
The corrective recovery identified in the October 28 report remains active, but the latest 4-hour chart provides a more defined resistance test rather than confirmation of a bearish reversal. Purple wave 2 is now marked at the recent rebound high, with the 50.0% Fibonacci retracement positioned near 7,750, above the current price of 7,728.10. This represents an upward adjustment from the previous report's resistance reference near 7,730, while the underlying bearish Elliott Wave scenario remains unchanged. The preceding blue five-wave decline, culminating in purple wave 1, continues to establish the larger structure against which the recovery is unfolding. The projected blue path allows for a final push toward Fibonacci resistance before turning lower, potentially initiating the next bearish phase toward 7,611.27. Until price rejects the resistance area and establishes renewed downside movement, the anticipated decline remains a projection rather than a confirmed development. The marked invalidation level at 7,843.89 is unchanged, maintaining the conditions of the existing bearish scenario.
Technical Summary of S&P 500 Price for October 29, 2026
-
Trend: Bearish, with a corrective rebound in progress.
-
Current Elliott Wave: Purple wave 1 labeled at the recent low; purple wave 2 marked at the corrective rebound.
-
Key Support Levels: Approximately 7,620; 7,611.27.
-
Key Resistance Levels: 50.0% Fibonacci retracement near 7,750; 7,843.89.
-
Next Price Target: 7,611.27, following the projected resistance test.
-
Invalidation Level: 7,843.89.
-
Fibonacci Levels: 50.0% retracement near 7,750.
Trader's Question: Is the S&P 500 approaching the end of its corrective rebound?
The chart places purple wave 2 near the 50.0% Fibonacci resistance around 7,750. A rejection from this area would support renewed downside toward 7,611.27, while a move above 7,843.89 would invalidate the displayed bearish scenario.