
The four-hour chart shows 7,694.36. Since October 16, the decline extended to 7,630.86, shifting the labelled iv endpoint lower. Its final C leg now carries five subdivisions, (1)–(5). The count retains a developing ending diagonal within (v), with v projected toward approximately 7,860. A break above 7,843.89 would support that advance; losing 7,630.86 would challenge the proposed completion of iv.
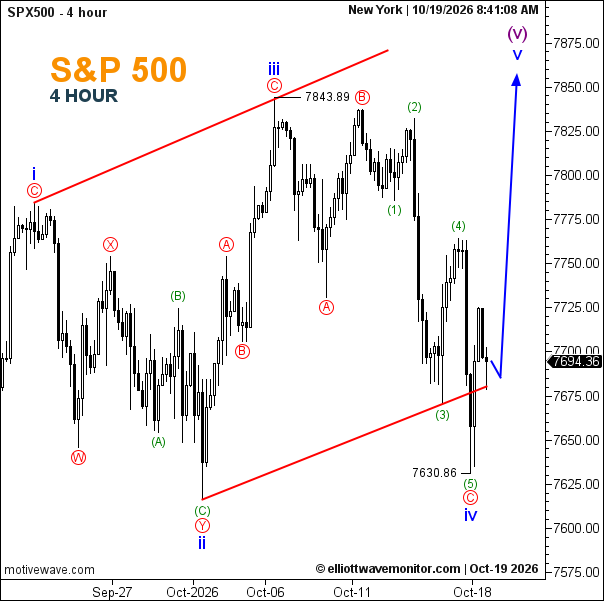
- Trend: Bullish recovery scenario following an extended correction.
- Trading Range: Broad boundaries at 7,630.86–7,843.89.
- Wave Structure: iv labelled complete; v anticipated to complete (v).
- Support: 7,630.86.
- Resistance: Approximately 7,725, then 7,843.89.
Is the S&P 500 bullish or bearish?
The count favours a bullish recovery while 7,630.86 holds. Below it, downside risk persists and iv requires reassessment.