
The S&P 500 is at 7,734.80, up from 7,694.36 on October 19. The chart still marks 7,630.86 as the blue-wave-(iv) low; the rebound supports a developing wave (v), projected toward approximately 7,875. That advance remains a scenario, with 7,843.89 as an overhead reference.
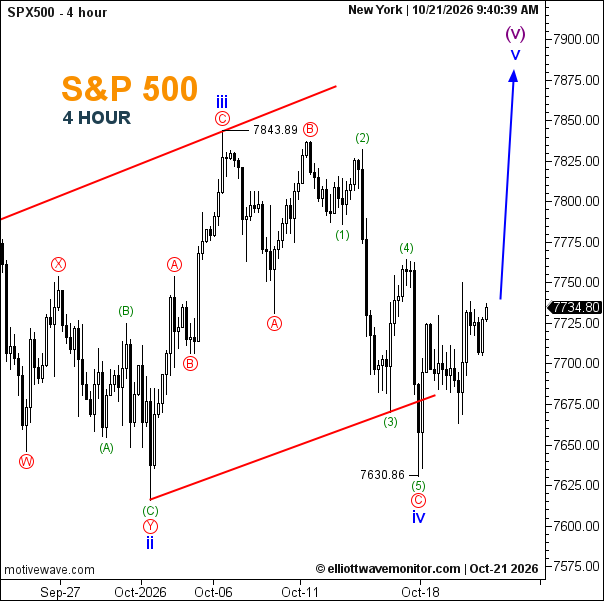
- Trend: Potential bullish wave-(v) recovery while 7,630.86 holds.
- Trading Range: 7,630.86–approximately 7,760 near term.
- Wave Structure: Wave (iv) is marked complete; wave (v) is developing.
- Support: 7,630.86.
- Resistance: Approximately 7,760, then 7,843.89.
Is the market bullish or bearish now? The chart favors a rebound while 7,630.86 holds; a break below it would challenge the wave-(v) scenario.