
The S&P 500 is trading near 7,811 on the four-hour chart, recovering toward its recent high of 7,843.89. The index remains within an advancing wave structure, although the Elliott Wave count suggests that the current rally may be approaching a significant turning point.
S&P 500 Elliott Wave Analysis and Forecast
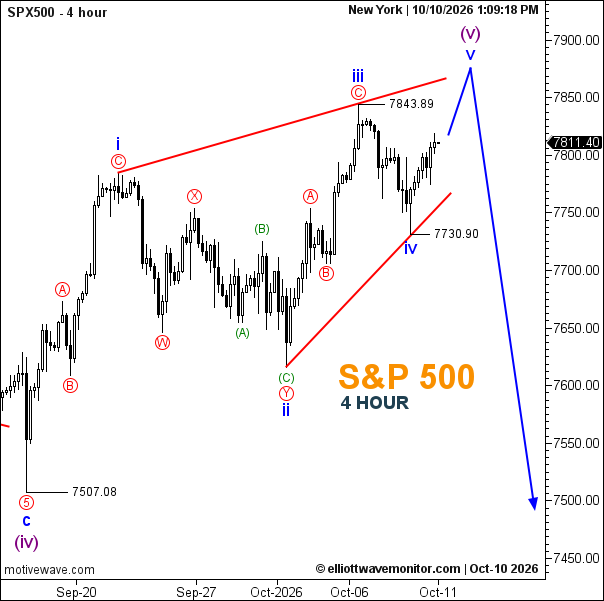 The S&P 500 Elliott Wave chart indicates that wave (iv) ended at 7,507.08, followed by a developing five-wave advance within wave (v). The internal structure shows waves i and ii completed, while wave iii reached 7,843.89 before giving way to a corrective wave iv.
With wave iv marked near 7,730.90, the preferred scenario anticipates a final advance in wave v toward the 7,850–7,900 region, potentially completing the larger wave (v).
A sustained break above 7,843.89 would strengthen the case for this final upward leg. However, the projected completion of wave (v) could mark the end of the broader bullish sequence and precede a substantial corrective decline.
Failure to establish a new high, particularly if followed by a break below 7,730.90, would weaken the immediate bullish outlook and raise the possibility that the anticipated reversal has already begun.