
Nasdaq 100 Rate: The NAS100 chart shows the index near 30,914 on the 4-hour timeframe, recovering from the 30,581.33 support area after retreating from 31,400.63. The immediate trend is corrective, although the latest price structure still allows another upward leg before a potential bearish reversal.
Nasdaq 100 Elliott Wave Analysis, Chart and Forecast
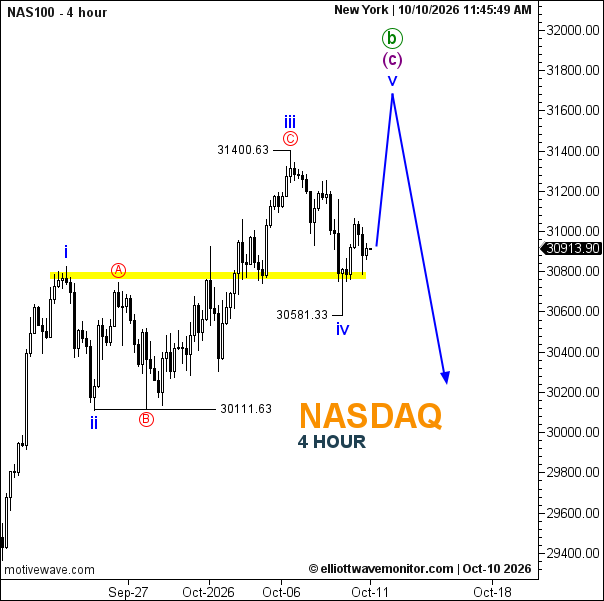 Nasdaq 100 Chart: The Elliott Wave count identifies an A-B-C correction ending at 30,581.33, followed by a developing five-wave advance. Wave iii reached 31,400.63, while wave iv subsequently tested 30,581.33, completing a pullback toward the highlighted support zone near 30,750–30,800.
Nasdaq 100 Forecast: The preferred scenario anticipates wave v advancing toward 31,600–31,700, completing the larger wave (c) and potentially wave b. This projected area represents a possible supply and reversal zone rather than confirmation of a sustained bullish trend.
The 30,750–30,800 band provides immediate support, followed by 30,581.33. A sustained break below 30,581.33 before a new high would weaken the expected wave v advance and bring the bearish alternative forward.
After wave b completes, the larger wave c could initiate a decline toward 30,200–30,100, with 30,111.63 providing an important historical support reference.
Nasdaq 100 Fibonacci: The projected wave v zone is consistent with a possible extension, but a precise Fibonacci ratio cannot be verified from the chart alone.
Nasdaq 100 News: U.S. inflation releases, Federal Reserve policy expectations, and major technology-company earnings are key factors to monitor. Specific upcoming releases require calendar verification.