
The S&P 500 has shifted to a bearish outlook on the 4-hour chart, trading near 7,639.27 following a sharp reversal from the 7,830–7,840 resistance zone. The Elliott Wave count shows a five-wave decline labeled (i)–(v), followed by a developing bearish sequence with wave 1 near the recent low and wave 2 projected as a corrective rebound. Compared with October 22, the anticipated bullish wave (v) scenario has weakened as selling pressure extended below 7,630.86. The blue projection suggests a temporary recovery toward 7,725 before renewed weakness toward 7,660. The annotated 7,598.48 level remains an important downside reference, while a sustained recovery above the highlighted resistance zone would challenge the bearish outlook.
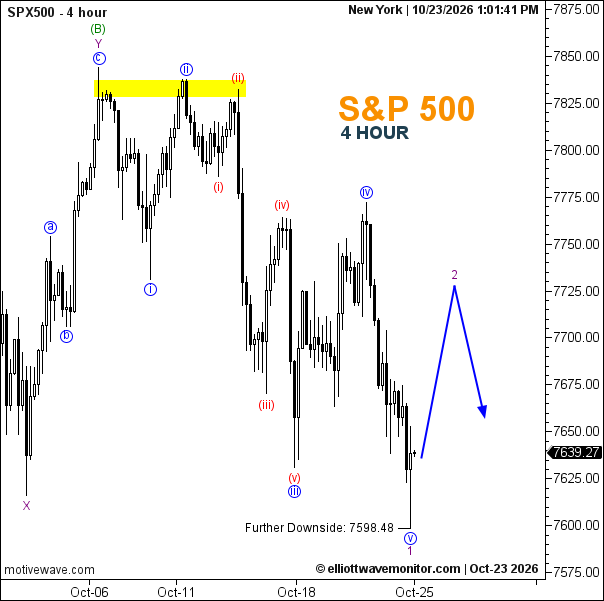
Technical Summary of S&P 500 Price for October 23, 2026
-
Trend: Bearish
-
Daily Support Levels: 7,630 (approximate); 7,598.48 (annotated downside reference).
-
Daily Resistance Levels: 7,725 (projected); 7,830–7,840 (highlighted resistance zone).
-
Elliott Wave Patterns: Five-wave bearish structure labeled (i)–(v), with wave 1 near the recent low and wave 2 projected as a corrective rebound before another decline.
-
Trading Range: Projected rebound zone 7,639–7,725.
Trader's Question: Has the S&P 500 invalidated its previous bullish wave scenario?
The decline below the previous 7,630.86 wave iv low weakens the bullish interpretation, while the latest chart favors a corrective rebound followed by renewed selling pressure.