Key Points
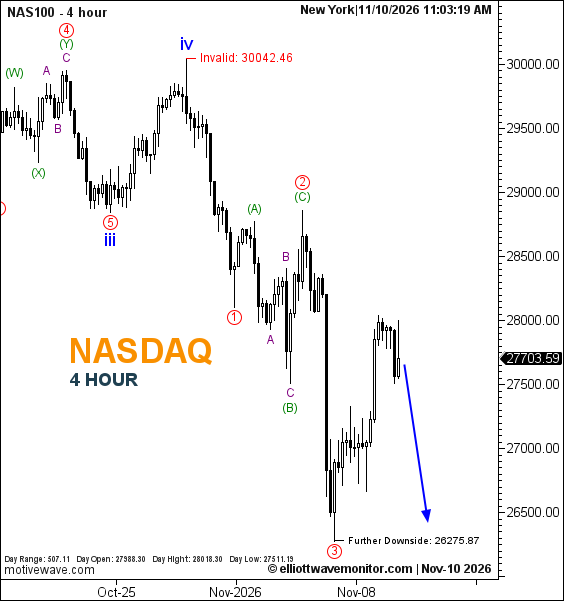
- Nasdaq 100 projects a further decline directly toward the former red-wave-3 trough at 26,275.87. Its current bearish invalidation is 30,042.46, expressly reinstated by the analyst in place of 28,862.80.
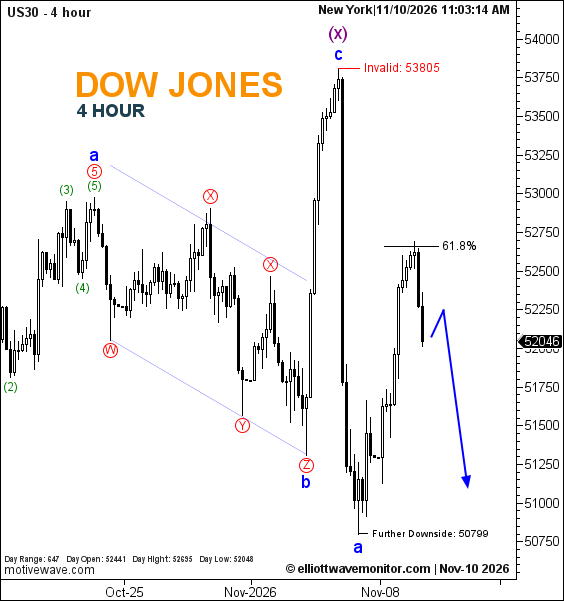
- Dow Jones has retreated after a corrective rise toward the marked 61.8% Fibonacci reference; its forecast path permits a brief recovery before renewed weakness.
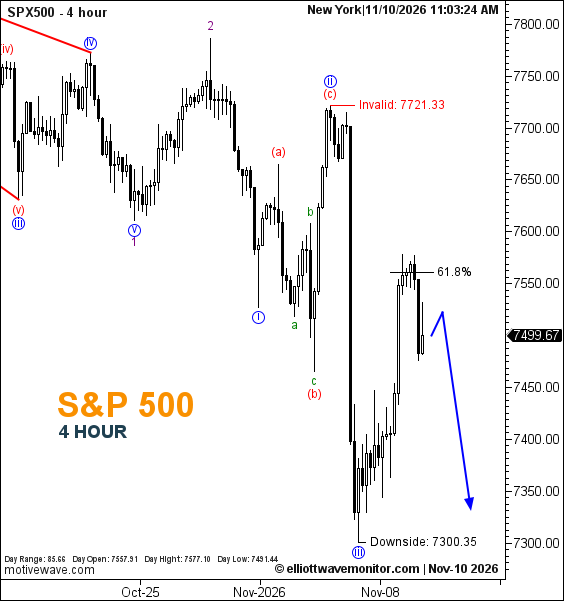
- S&P 500 has similarly pulled back following its recovery near 61.8%, while the projected downside reference remains 7,300.35.
The most consequential change in the November 10 four-hour index charts is the Nasdaq 100 (NAS100) scenario: following the corrective recovery and subsequent pullback, the analyst's new blue path points downward without an additional projected rebound. The chart displayed 27,703.59 at 11:03:19 a.m. New York time, with a recorded daily high of 28,018.30 and low of 27,511.19. These are chart observations, not independently verified live prices.
Red waves 1, 2 and 3 remain marked, with green (C) coinciding with the red-wave-2 recovery and red wave 3 at the earlier structural low beside 26,275.87. The November 9 US indices outlook still anticipated a Fibonacci-led recovery before another decline. The updated chart records a recovery followed by weaker candles, and the forecast now favors a direct revisit of the downside reference. The current 30,042.46 invalidation replaces the 28,862.80 threshold used in that report, by explicit analyst decision; the earlier number is historical, not a parallel active limit.
For Dow Jones (US30), the intervening recovery rose toward the 61.8% Fibonacci line before price turned lower. The chart displayed 52,046 at 11:03:14 a.m. New York time. The prior report's blue-wave-b recovery was a projection following the blue-wave-a trough at 50,799; the new recovery is observed, but its peak carries no explicit completed-b label. The connected blue path first indicates a modest rebound and then renewed downside. 50,799 is the chart's further-downside reference, with bearish invalidation at 53,805. That sequence follows the November 9 US30 outlook, without confirming the next decline as completed.
The S&P 500 (SPX500) records the next stage of its own correction. The chart's high of 7,577.10 accompanies a rebound toward the marked 61.8% retracement, followed by a renewed retreat to a displayed reading of 7,499.67 at 11:03:24 a.m. New York time. Blue wave (ii) remains at the previous high, while (iii) is labeled at the prior structural low. The preceding four-hour S&P 500 assessment projected a corrective recovery before a lower leg; the latest blue path now allows a short rise, then a decline, with 7,300.35 serving as the downside-continuation reference and 7,721.33 as invalidation.
Technical Outlook — H4
| Index | Forecast sequence | Downside reference | Bearish invalidation |
|---|---|---|---|
| NAS100 | Direct further decline projected | 26,275.87 | 30,042.46 |
| US30 | Short rebound, then potential decline | 50,799 | 53,805 |
| SPX500 | Short rebound, then potential decline | 7,300.35 | 7,721.33 |
Trader's Question: Do the rebounds followed by falling candles establish that every next bearish wave is complete?
Answer: No. Those reversals are observed, but the rightward blue arrows represent future paths. Each downside reference remains conditional on additional price movement, and the labeled Fibonacci line is not itself confirmation of a new completed wave.